Long
Long
GBPUSD – Could the Short Term Low Already be in Place?GBPUSD has been trending lower in September as interest rate differentials shift in favour of the US dollar (USD). This move gained further traction last week when the Bank of England kept interest rates on pause while the Federal Reserve hiked for the first time in 2026 and indicated there could be more to come later in the year.
Looking at the numbers, after printing a monthly high of 1.3568 on September 9th, GBPUSD dropped over 230 pips or 1.7% to print a 2-month low at 1.3335 on Friday last week before recovering back to current levels around 1.3382 (0645 BST).
This rebound could lead traders to question whether a short-term low could now be in place or if it’s just a pause before a deeper push to the downside is seen.
Looking forward at potential catalysts for GBPUSD volatility, US President Donald Trump is due to speak at the United Nations in New York later today. Any comments he makes regarding the conflict with Iran may be important.
Then, tomorrow’s release of the latest preliminary PMI surveys for the UK (0930 BST) and US (1445 BST) could provide an important insight into the health of both domestic economies. Any reading above 50 indicates economic expansion, while below 50 suggests contraction.
Finally, on Thursday FX traders may be on high alert to the key takeaways from the summit taking place in Washington between President Trump and Chinese President Xi. Headlines from initial talks between representatives from the world’s 2 biggest economies have indicated a tone of positivity regarding AI, investment and trade, but it could be interesting to see whether this results in anything concrete.
Technical Update: GBPUSD - 4 Hourly Outlook a Question of Key Retracement Levels:
The current 4‑hourly perspective may indicate a more balanced theme for GBPUSD, with key short-term support at 1.3344 and resistance at 1.3397 containing recent price activity.
As the chart below shows, last Friday saw an impressive recovery following tests of potential support at 1.3344 (61.8% retracement of June 24th to August 21st strength). However, the resulting price strength was in turn held by resistance at 1.3397 (38.2% retracement of September 16th to September 18th price weakness).
This could indicate that support at 1.3344 and resistance at 1.3397 represent key potential short‑term levels for traders to monitor. A 4‑hourly closing break out below or above either level could lead to further sustained price movement in the direction of the break.
Potential 4 Hourly Resistance Levels:
Having seen the latest price strength held, and for now reversed, by resistance at 1.3397 (38% retracement), this appears to be the first key shorter‑term resistance to monitor.
If a breakout above 1.3397 were to occur on a 4‑hourly closing basis, traders may then shift focus to 1.3417 (50% retracement) as the next resistance. If this level were also breached, upside momentum may continue toward 1.3436 (61.8% retracement).
Potential 4 Hourly Support Levels:
While the resistance level at 1.3397 remains intact it is possible that price action could turn lower again. If this were the case, traders may attempt to establish key support levels that, if broken, could see downside momentum emerge again.
Having seen the 1.3344 retracement level hold price weakness and help prompt the latest price recovery, 1.3344 appears to be the first short‑term support. If further downside is to be seen, it may be 4‑hourly closing breaks below 1.3344 that trigger it. Such a move could extend declines, shifting the focus toward the next potential support at 1.3273 (July 28th low).
The material provided here has not been prepared accordance with legal requirements designed to promote the independence of investment research and as such is considered to be a marketing communication. Whilst it is not subject to any prohibition on dealing ahead of the dissemination of investment research, we will not seek to take any advantage before providing it to our clients.
Pepperstone doesn’t represent that the material provided here is accurate, current or complete, and therefore shouldn’t be relied upon as such. The information, whether from a third party or not, isn’t to be considered as a recommendation; or an offer to buy or sell; or the solicitation of an offer to buy or sell any security, financial product or instrument; or to participate in any particular trading strategy. It does not take into account readers’ financial situation or investment objectives. We advise any readers of this content to seek their own advice. Without the approval of Pepperstone, reproduction or redistribution of this information isn’t permitted. SMCI GEX – Testing the Consolidation Ceiling at 42SMCI is tightening inside a sideways consolidation and is now testing the upper boundary of that range near 42. The current October 16 cumulative GEX profile places the dominant call wall at exactly the same level.
Strength across sector peers provides a supportive tape backdrop, but 42 remains the structural decision point. Price is near 40.95, above the 39 call-cluster boundary and well above the 36.5 HVL.
A clear break and hold above 42 would move SMCI into the positive extension zone, opening gamma squeeze potential toward 43 and then 45. Another rejection would keep the range intact and bring 39.5–39 back into focus.
🔶 Regime Context 🔶
SMCI remains above HVL in a positive GEX regime and is trading inside the call cluster between 39 and 42.
GEX History shows the 0, W1, M1, M2, and ALL rows aligned in positive gamma. This can support a more controlled volatility environment, but acceptance above 42 still requires price momentum.
🔶 Options Structure Context 🔶
👉 42 – C1 and consolidation ceiling
Confluence at 42:
C1 — dominant call wall
Ab1 — largest absolute gamma
COI / nCOI — strongest cumulative call open-interest concentration
AbOI — largest cumulative absolute open interest
CV / nCV — cumulative call-volume peak
This makes 42 a major multi-metric reaction zone in the October 16 cumulative profile, not simply a technical range boundary.
👉 43 – C3 , the next overhead call wall after a confirmed breakout
👉 45 – secondary positive NETGEX reference
🔶 Downside Structure 🔶
👉 39.5 – C2 , the first level to watch after a failed breakout
👉 39 – cTrans , the lower boundary of the call cluster
👉 36.5 – HVL / pTrans , the main regime pivot
👉 35 – P1 , the dominant put wall
🔶 Options Sentiment 🔶
CALL$ 93% at 60 DTE means equidistant call options are priced 93% higher than the corresponding puts. This reflects elevated call pricing skew, not a directional guarantee.
The Options Oscillator’s green histogram remains below its recent peak, suggesting that call pricing skew has been broadly fading despite staying elevated.
IVRank 24.2
IVx 74.2 (60 DTE)
CALL$ 93% (60 DTE) — call pricing skew
Implied move ±6.17% (±2.5)
🔶 Key Structure to Watch 🔶
42 — C1, multi-metric confluence and range ceiling
43–45 — first extension references after acceptance
39.5–39 — first support area after a failed breakout
36.5 — HVL and regime pivot
For now, SMCI is building pressure beneath its dominant call wall while sector strength remains supportive.
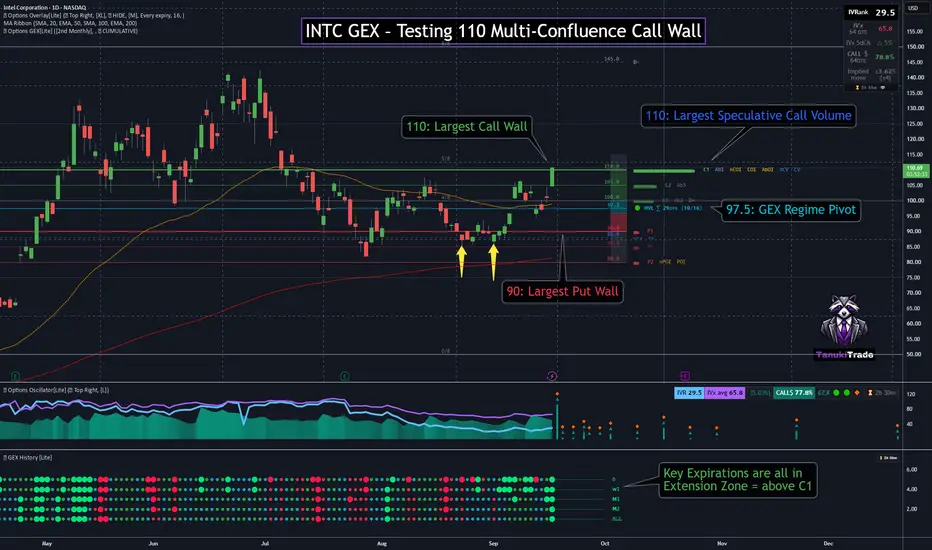
The key question is whether price can accept above 42 and enter extension—or reject once again into the established range. INTC GEX – Testing 110 Multi-Confluence Call WallINTC is pressing into 110 on the daily chart after a strong momentum expansion. Spot is only marginally above the level, so this remains a test rather than confirmed acceptance.
The October 16 cumulative GEX profile makes 110 the central decision point. It is the highest call wall and also overlaps a technically important reaction area visible on the daily chart.
🔶 Regime Context 🔶
With price above the 97.5 HVL and the 100 call-cluster boundary, INTC remains in a positive GEX regime.
GEX History shows 0, W1, M1, M2, and ALL aligned in large-green positive extension. This is a dampening-volatility backdrop rather than a directional signal. The current momentum candle is testing C1, but acceptance still requires a sustained hold above 110.
🔶 Options Structure Context 🔶
👉 110 – C1 multi-confluence wall
Confluence at 110:
C1 — highest call NETGEX
Ab1 — largest absolute gamma
nCOI / COI / AbOI — dominant call and absolute open-interest concentration
CV / PV — largest cumulative call- and put-volume peaks
This makes 110 a major reaction zone rather than merely a round-number resistance. Since both call and put volume peak here, the volume concentration is two-sided and should not be treated as a standalone bullish flow signal.
🔶 Key Structure to Watch 🔶
Above 110 — sustained acceptance keeps INTC in positive extension, with gamma squeeze potential toward the 115 and 120 secondary NETGEX references
Below 110 — rejection returns price toward 105, followed by the 100 call-cluster boundary
97.5 — HVL and GEX regime pivot
90 — strongest put wall (P1)
For now, 110 is where the technical structure, C1, absolute gamma, open interest, and volume all meet.
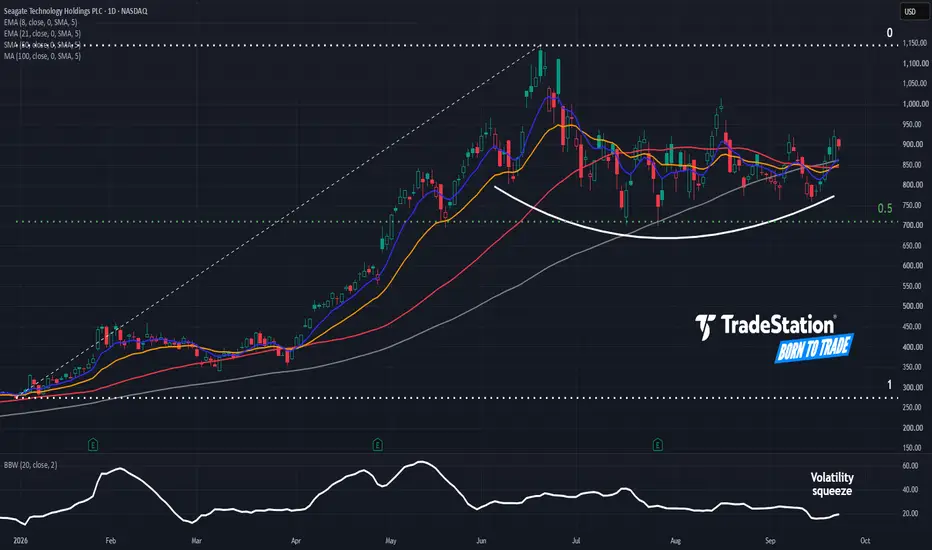
The key question is whether INTC can turn 110 from resistance into support—or whether this extension test ends in rejection. Seagate’s High Basing PatternSeagate Technology rallied sharply in the first half. Is it poised to continue higher?
The first item on today’s chart is the sideways consolidation period in July, August and September. Some traders may view it as a high basing pattern instead of a reversal.
Second, STX held a 50 percent retracement between its price at the end of 2025 and its peak in June. That may suggest its upward direction remains intact.
Third, Bollinger Bandwidth has narrowed. Could prices start moving after that period of compression?
Next, the stock is pushing back above its 50-day simple moving average (SMA) and has held its rising 100-day SMA. That could reflect intermediate- and long-term bullishness.
Finally, STX’s 8-day exponential moving average (EMA) recently pushed above its 21-day EMA. That may suggest its short-term momentum has grown more bullish.
TradeStation has, for decades, advanced the trading industry, providing access to stocks, options and futures. If you're born to trade, we could be for you. Learn more here about TradingView’s Broker of the Year!
Past performance, whether actual or indicated by historical tests of strategies, is no guarantee of future performance or success. There is a possibility that you may sustain a loss equal to or greater than your entire investment regardless of which asset class you trade (equities, options or futures); therefore, you should not invest or risk money that you cannot afford to lose. Online trading is not suitable for all investors. View the document titled Characteristics and Risks of Standardized Options at www.TradeStation.com . Before trading any asset class, customers must read the relevant risk disclosure statements on www.TradeStation.com . System access and trade placement and execution may be delayed or fail due to market volatility and volume, quote delays, system and software errors, Internet traffic, outages and other factors.
Securities and futures trading is offered to self-directed customers by TradeStation Securities, Inc., a broker-dealer registered with the Securities and Exchange Commission and a futures commission merchant licensed with the Commodity Futures Trading Commission). TradeStation Securities is a member of the Financial Industry Regulatory Authority, the National Futures Association, and a number of exchanges.
TradeStation Securities, Inc. and TradeStation Technologies, Inc. are each wholly owned subsidiaries of TradeStation Group, Inc., both operating, and providing products and services, under the TradeStation brand and trademark. When applying for, or purchasing, accounts, subscriptions, products and services, it is important that you know which company you will be dealing with. Visit www.TradeStation.com for further important information explaining what this means.  Long
Long
Gold – Stuck Riding the Fed Rate Outlook RollercoasterAfter last week’s sell off on Wednesday evening from 4360 down to a low of 4235 upon learning the Federal Reserve (Fed) had raised interest rates for the first time in 2026 and then the subsequent recovery back to close the week at 4378 on Friday, Gold prices seemingly continue to ride the positioning rollercoaster driven by market expectations of what the Fed may do next regarding interest rates over the final 3 months of 2026.
Hawkish comments from Fed member Kashkari on Sunday may have weighed on sentiment towards Gold early on Monday morning, helping to take prices down 0.7% to current levels around 4348. He suggested US inflation remains too high, and pressures may have broadened beyond the oil price shock of the Iran war (Bloomberg).
There could be more interest rate outlook headline driven volatility to come, with a variety of Federal Reserve policymakers scheduled to speak across the rest of the week. Traders remain sensitive to the possibility of 1 or even 2 further Fed hikes before the end of the year, and any comments that may support this outlook could further weigh on Gold prices which pay no interest or dividend.
Looking forward, it’s a quiet week for economic data so Gold traders may choose to focus on Fed policymaker commentary, the outcomes of the US-China Summit between President’s Trump and Xi on Thursday and any further updates on the possibility of finding a diplomatic solution to ease tensions in the Middle East.
Technical Update: Are Gold Buyers Attempting to Gain the Upper Hand?
From the August 25th high of 4697 down to the September 16th low at 4235 Gold has seen a roughly 10% decline, potentially as a reaction to what was a strong period of price strength for the metal between July 17th and August 25th (3959 to 4697). What is perhaps an encouraging sign for Gold bulls is that a key support at 4232 (61.8% Fibonacci retracement of the July 17th to August 25th strength) has helped to hold the recent decline and prompt an attempt at a recovery.
While this price action may appear to identify 4232 as the first key support focus for the coming week, what could be equally important is the declining Bollinger mid‑average as a resistance level. As the chart above shows, the mid-average resistance currently stands at 4407. The directional bias for Gold this week could be determined by which of these important levels either holds or gives way on a closing basis.
Potential Resistance Focus:
A falling Bollinger mid‑average that is above price activity always has the potential to be an important resistance focus. Therefore, 4407 is set to be monitored this week, with successful closing breaks above this level needed to suggest further attempts at price strength.
If a closing break above 4407 is seen, risks may then be skewed for further price strength to challenge the next potential resistance at 4511 (September 3rd high), and even 4697 (August 25th high). If 4697 were also to give way on a closing basis, it could see a continuation of the advance to challenge 4770 (50% Fibonacci retracement of January 29th to June 30th price weakness).
Potential Support Focus:
While the Bollinger mid‑average resistance at 4407 remains intact downside momentum may reemerge. This could open the way for retests of support at 4232 (61.8% retracement) to develop, with closing breaks below this level indicating the possibility of further negative momentum materialising.
If 4232 were broken on a closing basis, downside risks could shift toward tests of what might be viewed as a potentially strong support band between 3943 and 3959 (June 30th and July 17th price lows).
The material provided here has not been prepared accordance with legal requirements designed to promote the independence of investment research and as such is considered to be a marketing communication. Whilst it is not subject to any prohibition on dealing ahead of the dissemination of investment research, we will not seek to take any advantage before providing it to our clients.
Pepperstone doesn’t represent that the material provided here is accurate, current or complete, and therefore shouldn’t be relied upon as such. The information, whether from a third party or not, isn’t to be considered as a recommendation; or an offer to buy or sell; or the solicitation of an offer to buy or sell any security, financial product or instrument; or to participate in any particular trading strategy. It does not take into account readers’ financial situation or investment objectives. We advise any readers of this content to seek their own advice. Without the approval of Pepperstone, reproduction or redistribution of this information isn’t permitted. Long 
Best Free Volatility Indicator on TradingView
This free technical indicator will help you easily measure the market volatility on Forex, Gold or any other market.
It will show you when the market is quiet, when it's active and when it's dangerous .
We will go through the settings of this indicator, and you will learn how to set it up on TradingView.
Historical Volatility Indicator
This technical indicator is called H istorical Volatility.
It is absolutely free and available on TradingView, MetaTrader 4/5 and other popular trading terminals.
TradingView Setup
Let me show you how to find it on TradingView and add it to your price chart.
Open a technical price chart on TradingView and open the "Indicators" menu (you will find it at the top of the screen).
Search " Historical Volatility " and click on it.
It will automatically appear on your chart.
Double-click on the indicator and a settings menu will appear.
"Length" parameter will define how many candles the indicator will take for measuring the average volatility. (I recommend keeping the default number, but if you need longer/shorter-term volatility, you can play with that)
Timeframe drop-down list defines what time frame the indicator takes for measuring the volatility. (I recommend choosing a daily timeframe)
And keep the checkboxes unchanged .
How to Use the Indicator
Now, let me show you how to use it properly.
Widen the indicator and analyse its movement at least for the last 4 months.
Find the volatility range - its low levels will be based on the lower boundary of the range, high levels will be based on its upper boundary.
This is an example of such a range on USDCAD pair.
When the volatility stays within the range, it is your safe time to trade.
When volatility approaches its lows , it may indicate that the market might be slow .
Highs of the range imply that the market is very active .
In-between will mean a healthy market.
The Extremes
The violation of a volatility range to the downside is the signal that the market is very slow. This would be the recommended period to not trade because of high chance of occurrence of fakeouts .
An upward breakout of a voliatlity range is the signal of the extreme volatility . It will signify that the market is unstable, and it will be better to let it calm down before placing any trade.
Volatility Analysis
That is how a complete volatility analysis should look.
At the moment, volatility reached extreme levels on CADJPY pair.
The best strategy will be to wait till it returns within the range.
Remember This
With the current geopolitical uncertainty and trade wars, market volatility reaches the extreme levels.
Such a volatility is very dangerous, especially for newbie traders.
Historical volatility technical indicator will help you to easily spot the best period for trading and the moment when it is better to stay away.
❤️Please, support my work with like, thank you!❤️
I am part of Trade Nation's Influencer program and receive a monthly fee for using their TradingView charts in my analysis.
 Education
Could Alphabet Start Moving Again?Alphabet has drifted for months, but some traders may think it’s ready to start moving again.
The first pattern on today’s chart is the long pullback since mid-May, which has seen the Internet giant bounce twice at its rising 200-day simple moving average (SMA). That may confirm a longer-term uptrend is in place.
Second, GOOGL is pushing above its 50-day SMA. That could suggest the intermediate-term trend is getting bullish again.
Third, MACD is rising and the 8-day exponential moving average (EMA) crossed above the 21-day EMA. That may indicate its short-term trend is also turning positive.
Next, Bollinger Band Width has narrowed as prices converge. Could that narrowing price action give way to expansion?
Finally, GOOGL is an active underlier in the options market. (Its average daily volume of 367,500 contracts ranks 11th in the S&P 500, according to TradeStation data.) That could help traders take positions with calls and puts.
TradeStation has, for decades, advanced the trading industry, providing access to stocks, options and futures. If you're born to trade, we could be for you. Learn more here about TradingView’s Broker of the Year!
Past performance, whether actual or indicated by historical tests of strategies, is no guarantee of future performance or success. There is a possibility that you may sustain a loss equal to or greater than your entire investment regardless of which asset class you trade (equities, options or futures); therefore, you should not invest or risk money that you cannot afford to lose. Online trading is not suitable for all investors. View the document titled Characteristics and Risks of Standardized Options at www.TradeStation.com . Before trading any asset class, customers must read the relevant risk disclosure statements on www.TradeStation.com . System access and trade placement and execution may be delayed or fail due to market volatility and volume, quote delays, system and software errors, Internet traffic, outages and other factors.
Securities and futures trading is offered to self-directed customers by TradeStation Securities, Inc., a broker-dealer registered with the Securities and Exchange Commission and a futures commission merchant licensed with the Commodity Futures Trading Commission). TradeStation Securities is a member of the Financial Industry Regulatory Authority, the National Futures Association, and a number of exchanges.
Options trading is not suitable for all investors. Your TradeStation Securities’ account application to trade options will be considered and approved or disapproved based on all relevant factors, including your trading experience. See www.TradeStation.com . Visit www.TradeStation.com for full details on the costs and fees associated with options.
Margin trading involves risks, and it is important that you fully understand those risks before trading on margin. The Margin Disclosure Statement outlines many of those risks, including that you can lose more funds than you deposit in your margin account; your brokerage firm can force the sale of securities in your account; your brokerage firm can sell your securities without contacting you; and you are not entitled to an extension of time on a margin call. Review the Margin Disclosure Statement at www.TradeStation.com .
TradeStation Securities, Inc. and TradeStation Technologies, Inc. are each wholly owned subsidiaries of TradeStation Group, Inc., both operating, and providing products and services, under the TradeStation brand and trademark. When applying for, or purchasing, accounts, subscriptions, products and services, it is important that you know which company you will be dealing with. Visit www.TradeStation.com for further important information explaining what this means. Long