Long
Long
Short time in BNB tooHello Traders!
Market is strong bearish and BNB is also showing very strong bearish patterns.
BNB is inside an expanding triangle. There is a chance that BNB will move up to touch the line but we are not waiting for that as market is strong bearish so we are Selling BNB From 573
Stoploss 600(-4.5%)
Target 535(+6.8%)
My goal is to be recognized as one of the highest win-rate traders in the TradingView community. :)
Trade Analysis Based on
> Fibonacci Tool (A1000x Way) – Custom Fibonacci approach for precise market analysis
> Candlestick Patterns – Strong price action confirmation through key candle formations
> A1000x Breakout Strategy – Identifying and trading high-probability breakout setups
> HH, HL & LH, LL Strategy – Market structure analysis for clear trend direction
> Swing Points – Tracking key highs and lows for accurate price movement insight
> A1000x Stoploss Strategy – Strategic stoploss placement for effective risk control
> A1000x Target Strategy – Structured target setting based on price action
We trade using carefully developed strategies and disciplined market analysis, always seeking the best possible accuracy while remembering that ultimate success comes only by the will of Allah.
In some trades, you may notice a relatively larger stop loss or a risk-to-reward ratio that may appear unusual at first glance. However, every trade is taken with proper planning and calculated analysis, not random entries.
Before entering any position, we perform detailed calculations and market evaluation. Based on this analysis, we carefully determine our stop loss and target levels.
I personally apply one of my specialized stop-loss and target strategies, designed to place the stop loss at a logical market level where price is less likely to reach before moving toward the intended target — InshaAllah.
Trading always involves risk, but with discipline, patience, and proper strategy, we aim for consistent and responsible decision-making.
Feel free to share your thoughts, leave a comment, or contact me.  Short
Short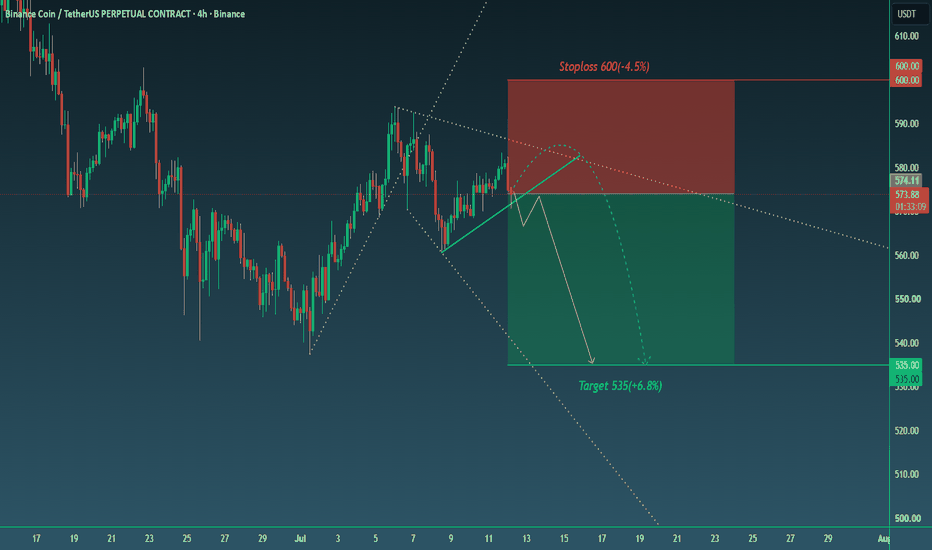
BTCUSDT: Changing the BEATHello Traders!
First of all this looks unrealistic target with mega dump, But those who trade with A1000x knows very well we don't miss our targets.
If we watch the current pattern there is Triangle breakout and now market is forming a reversal pattern. Which means it is ready for a dump.
Now lets talk about 49,500 Target. Its not a new pattern, Its an old pattern. Even when market was at peak it was supposed to dump to 49,500. It made perfect bullish move and crossed 100K after 100K there was no way it can cross 150K or 200K without breaking 49,500.
(I didn't knew earlier because this strategy is not that old).
I am also learning a new pattern in which it will be confirmed that whether BTC will cross 22K or not. Because there is a tricky pattern at 22K and its possible that BTC will touch it but its not confirmed yet.
We are Selling BTC from 73,750
Stoploss 67,700(-6%)
Target 49,500 (+22.4%)
My goal is to be recognized as one of the highest win-rate traders in the TradingView community. :)
Trade Analysis Based on
> Fibonacci Tool (A1000x Way) – Custom Fibonacci approach for precise market analysis
> Candlestick Patterns – Strong price action confirmation through key candle formations
> A1000x Breakout Strategy – Identifying and trading high-probability breakout setups
> HH, HL & LH, LL Strategy – Market structure analysis for clear trend direction
> Swing Points – Tracking key highs and lows for accurate price movement insight
> A1000x Stoploss Strategy – Strategic stoploss placement for effective risk control
> A1000x Target Strategy – Structured target setting based on price action
We trade using carefully developed strategies and disciplined market analysis, always seeking the best possible accuracy while remembering that ultimate success comes only by the will of Allah.
In some trades, you may notice a relatively larger stop loss or a risk-to-reward ratio that may appear unusual at first glance. However, every trade is taken with proper planning and calculated analysis, not random entries.
Before entering any position, we perform detailed calculations and market evaluation. Based on this analysis, we carefully determine our stop loss and target levels.
I personally apply one of my specialized stop-loss and target strategies, designed to place the stop loss at a logical market level where price is less likely to reach before moving toward the intended target — InshaAllah.
Trading always involves risk, but with discipline, patience, and proper strategy, we aim for consistent and responsible decision-making.
Feel free to share your thoughts, leave a comment, or contact me.  Short
Short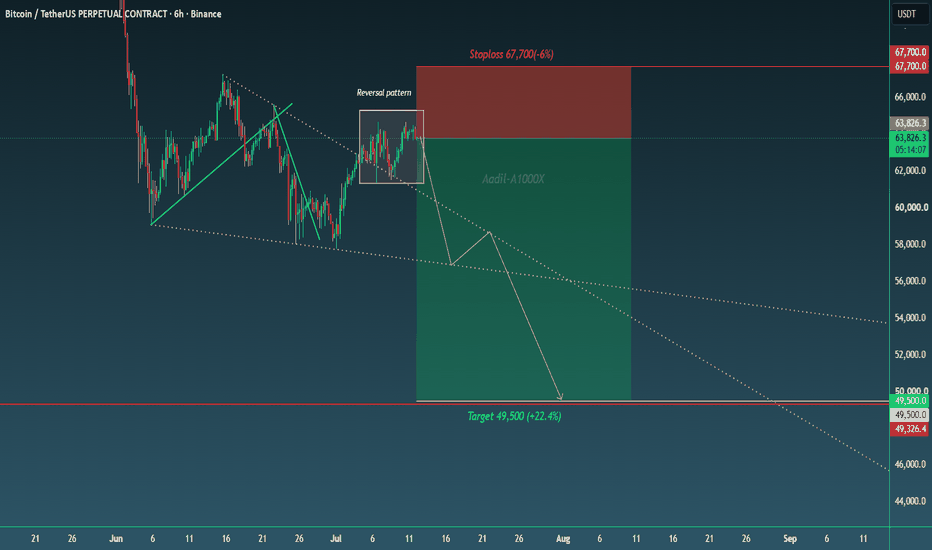
Crash in MorphousdtHello Traders!
MORPHOUSE is at the peak and bulls are not able to push it further and market is forming bearish pattern. There will be a crash in Morphousdt.
We can see a rising triangle in MORPHOUSE and there will be a crash soon after breakout and there are multiple bearish patterns in Morphousdt.
We are selling Morphousdt from 2.1
Stoploss 2.2695(-7.9%)
Target 1.7612(+16.2%)
My goal is to be recognized as one of the highest win-rate traders in the TradingView community. :)
Trade Analysis Based on
> Fibonacci Tool (A1000x Way) – Custom Fibonacci approach for precise market analysis
> Candlestick Patterns – Strong price action confirmation through key candle formations
> A1000x Breakout Strategy – Identifying and trading high-probability breakout setups
> HH, HL & LH, LL Strategy – Market structure analysis for clear trend direction
> Swing Points – Tracking key highs and lows for accurate price movement insight
> A1000x Stoploss Strategy – Strategic stoploss placement for effective risk control
> A1000x Target Strategy – Structured target setting based on price action
We trade using carefully developed strategies and disciplined market analysis, always seeking the best possible accuracy while remembering that ultimate success comes only by the will of Allah.
In some trades, you may notice a relatively larger stop loss or a risk-to-reward ratio that may appear unusual at first glance. However, every trade is taken with proper planning and calculated analysis, not random entries.
Before entering any position, we perform detailed calculations and market evaluation. Based on this analysis, we carefully determine our stop loss and target levels.
I personally apply one of my specialized stop-loss and target strategies, designed to place the stop loss at a logical market level where price is less likely to reach before moving toward the intended target — InshaAllah.
Trading always involves risk, but with discipline, patience, and proper strategy, we aim for consistent and responsible decision-making.
Feel free to share your thoughts, leave a comment, or contact me.  Short
Short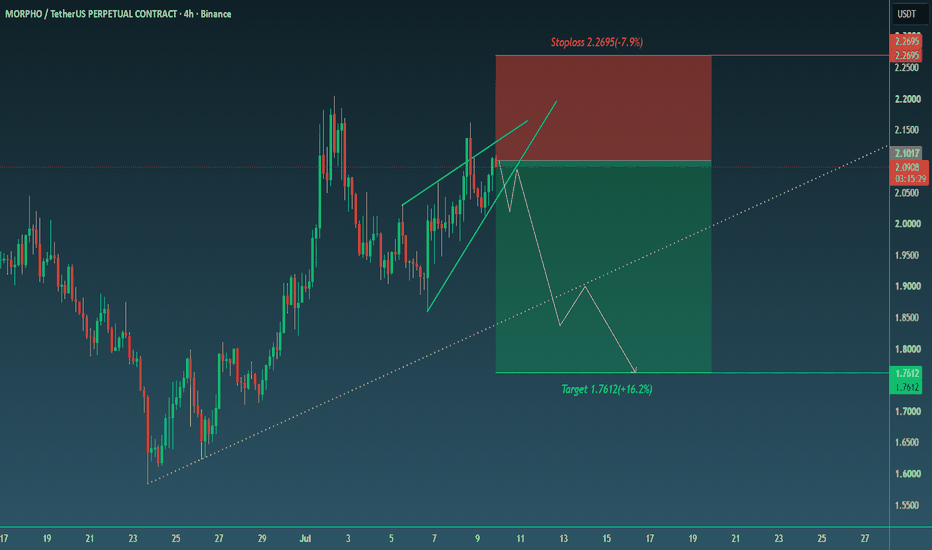
 Short
Short
 Short
Short
Aigensyn is at the bottomHello Traders!
After a massive win in Aigensyn we are entering again. We are again buying it from 0.027.
In chart we can see there is a breakout of a pattern but after breaking, Aigensyn is forming a reversal pattern which means it is going to push the price back inside the pattern. There are many more bullish confirmations in this pair.
We are buying Aigensyn from 0.027
Stoploss 0.02542(-5.7%)
Target 0.03270(+21.2%)
My goal is to be recognized as one of the highest win-rate traders in the TradingView community. :)
Trade Analysis Based on
> Fibonacci Tool (A1000x Way) – Custom Fibonacci approach for precise market analysis
> Candlestick Patterns – Strong price action confirmation through key candle formations
> A1000x Breakout Strategy – Identifying and trading high-probability breakout setups
> HH, HL & LH, LL Strategy – Market structure analysis for clear trend direction
> Swing Points – Tracking key highs and lows for accurate price movement insight
> A1000x Stoploss Strategy – Strategic stoploss placement for effective risk control
> A1000x Target Strategy – Structured target setting based on price action
We trade using carefully developed strategies and disciplined market analysis, always seeking the best possible accuracy while remembering that ultimate success comes only by the will of Allah.
In some trades, you may notice a relatively larger stop loss or a risk-to-reward ratio that may appear unusual at first glance. However, every trade is taken with proper planning and calculated analysis, not random entries.
Before entering any position, we perform detailed calculations and market evaluation. Based on this analysis, we carefully determine our stop loss and target levels.
I personally apply one of my specialized stop-loss and target strategies, designed to place the stop loss at a logical market level where price is less likely to reach before moving toward the intended target — InshaAllah.
Trading always involves risk, but with discipline, patience, and proper strategy, we aim for consistent and responsible decision-making.
Feel free to share your thoughts, leave a comment, or contact me.  Long
Long
 Long
Long
 Long
Long
Big bullish move in BeraHello Traders!
This is a wonderful opportunity in Bear as this pump is more than a 100% move.
We can see a golden trendline on the chart. This is the main trendline for now, and BERA is moving around it.
Earlier, BERA formed a reversal pattern after breaking above the trendline, which pushed the price down. Now, it is forming another pattern that looks like a "W" shape. If this pattern plays out, it could push the price higher.
My target is 0.60, but the price could reach as high as 0.63. There is still a chance of a small move lower before the rally begins, but I expect BERA to reach 0.60 very soon.
My goal is to be recognized as one of the highest win-rate traders in the TradingView community. :)
Trade Analysis Based on
> Fibonacci Tool (A1000x Way) – Custom Fibonacci approach for precise market analysis
> Candlestick Patterns – Strong price action confirmation through key candle formations
> A1000x Breakout Strategy – Identifying and trading high-probability breakout setups
> HH, HL & LH, LL Strategy – Market structure analysis for clear trend direction
> Swing Points – Tracking key highs and lows for accurate price movement insight
> A1000x Stoploss Strategy – Strategic stoploss placement for effective risk control
> A1000x Target Strategy – Structured target setting based on price action
We trade using carefully developed strategies and disciplined market analysis, always seeking the best possible accuracy while remembering that ultimate success comes only by the will of Allah.
In some trades, you may notice a relatively larger stop loss or a risk-to-reward ratio that may appear unusual at first glance. However, every trade is taken with proper planning and calculated analysis, not random entries.
Before entering any position, we perform detailed calculations and market evaluation. Based on this analysis, we carefully determine our stop loss and target levels.
I personally apply one of my specialized stop-loss and target strategies, designed to place the stop loss at a logical market level where price is less likely to reach before moving toward the intended target — InshaAllah.
Trading always involves risk, but with discipline, patience, and proper strategy, we aim for consistent and responsible decision-making.
Feel free to share your thoughts, leave a comment, or contact me.  Long
Long
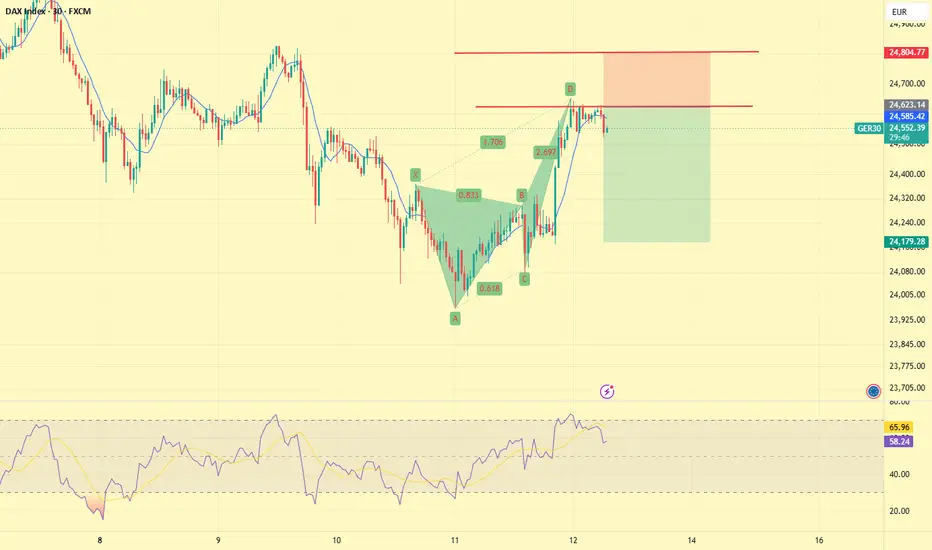
GER30 SHORT• Alignment with the H4 and Daily Trend
This setup is supported by the broader H4 and Daily directional bias. While the market has recently pushed higher, the larger trend structure still favors downside pressure, making this an attractive area to look for short opportunities rather than chasing further upside.
• Retest of a Key Rejection Zone
Price has returned to a significant level that has acted as resistance over the past two weeks. This area has repeatedly rejected bullish advances, and the current test may present another opportunity for sellers to step into the market.
• Bearish Divergence Across Multiple Timeframes
Several lower and medium timeframes are showing bearish divergence, where price continues to push higher while momentum indicators fail to confirm the move. This suggests that buying pressure may be weakening and that underlying market strength is beginning to fade.
• Deep Harmonic Pattern Completion on M30 and H1
A bearish Deep Crab harmonic pattern is completing on both the M30 and H1 timeframes, creating a potential reversal zone at current levels. Harmonic completions at resistance often signal exhaustion and can precede strong reversals when combined with other confluences.
• Trend Exhaustion After an Extended Move
The market has experienced a strong upward push into resistance, but momentum is beginning to flatten. Extended moves often require a retracement before continuation, especially when the price reaches a significant resistance zone.
• Strong Resistance Confluence
This level has proven itself as a major barrier over the past two weeks. The more times a market reacts from a level, the more important it becomes. Current price action suggests buyers are struggling to establish acceptance above this area.
• Potential Lower High Formation
If price rejects from this zone, it could establish a lower high within the broader bearish structure, reinforcing the possibility of further downside continuation in line with the H4 and Daily trend.
• Confluence of Resistance and Reversal Signals
When higher-timeframe trend alignment, resistance, divergence, harmonic completion, and momentum exhaustion all converge at the same level, the probability of a reaction increases significantly. This creates a high-confluence zone that warrants close monitoring.
Entry Zone: 24,635
Stop Loss: 24,800
1st Target: 24190  Short
Short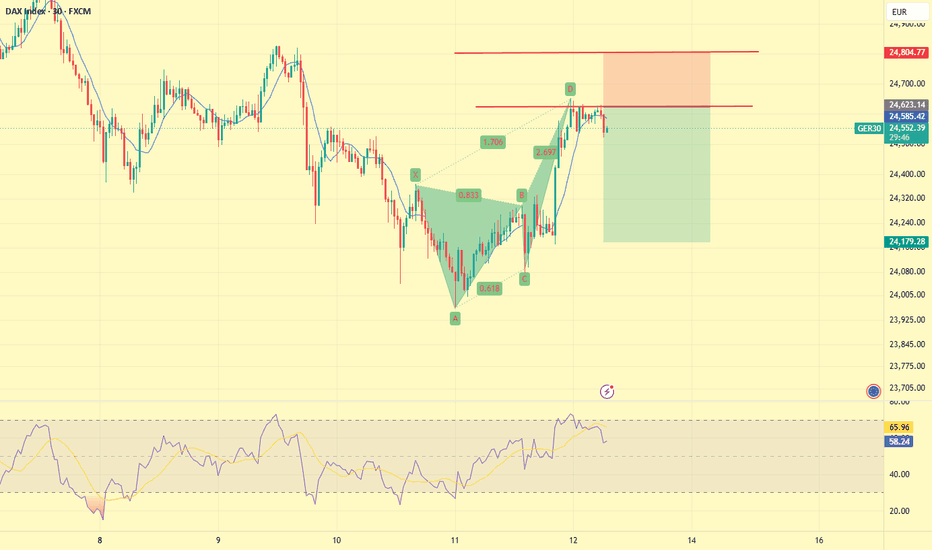
GBPUSD: Dual-Timeframe Triangle Play—Tactical 2X Bounce off MajoWe are breaking down a highly precise dual-timeframe study on the British Pound vs. US Dollar ( OANDA:GBPUSD - OANDA), mapping out an asymmetrical, short-term long opportunity within a dominant macro compression pattern.
### 1. The Macro Range & Daily Outlook (Ref: GBPUSD_2026-06-08_08-35-14.png)
On the Daily (1D) chart, the Cable is trading inside a massive historical rectangle structure bounded by **1.38700** at the ceiling and **1.31080** at the floor. This provides a clear high-level blueprint: buy the extreme support block and sell the premium resistance walls.
Within this range, price action has condensed into a large symmetrical triangle. Gold-standard technical indicators show the market currently interacting with a multi-month Ascending Trendline (LTA). If this regional cushion holds, the daily momentum is primed to rotate upward to test the horizontal resistance cluster at **1.35079**, with an extended structural macro target sitting up at **1.3580** near the descending upper trendline (LTB).
### 2. The Tactical H4/H1 Execution Matrix (Ref: GBPUSD_2026-06-08_08-34-33.png)
While the daily chart prepares its larger rotation, the short-term order flow on the 4-Hour (H4) chart has presented an ideal entry node for swing traders looking for a quick, high-probability execution:
* **The Setup:** The aggressive markdown has decelerated directly into the LTA support zone. Price is stabilizing around the **1.33410** area, offering a low-risk spot to position against near-term sellers.
* **Risk/Reward Parameters:** The long position tool establishes a tight, professional framework:
* **Entry Trigger:** Market entry around the current stabilization zone (**1.33410**–**1.33518**).
* **Stop Loss:** Firmly invalidating below the key structural line at **1.33153**.
* **Take Profit (2.0X Ratio):** Plotted right below the overhead EMA cluster at **1.34249**. This delivers a strict 2:1 mathematical matrix, optimized for a quick H1/H4 momentum play.
### Trade Management Playbook:
As price Approaches the 1.0X mark near the daily 200 EMA (**1.34042**), we will liquidate **50% of the position** to eliminate directional risk and trail the remainder to breakeven, allowing the final portion to run toward the upper **1.34249** target wall.
---
📊 **ChartPro Data** | By Rogerio
*Systematic Foreign Exchange Research, Price Action Confluences & Trade Geometry.*
⚠️ **Disclaimer:** For educational and informational purposes only. This technical chart study represents a personal trading model and does not constitute financial or investment advice.  Long
Long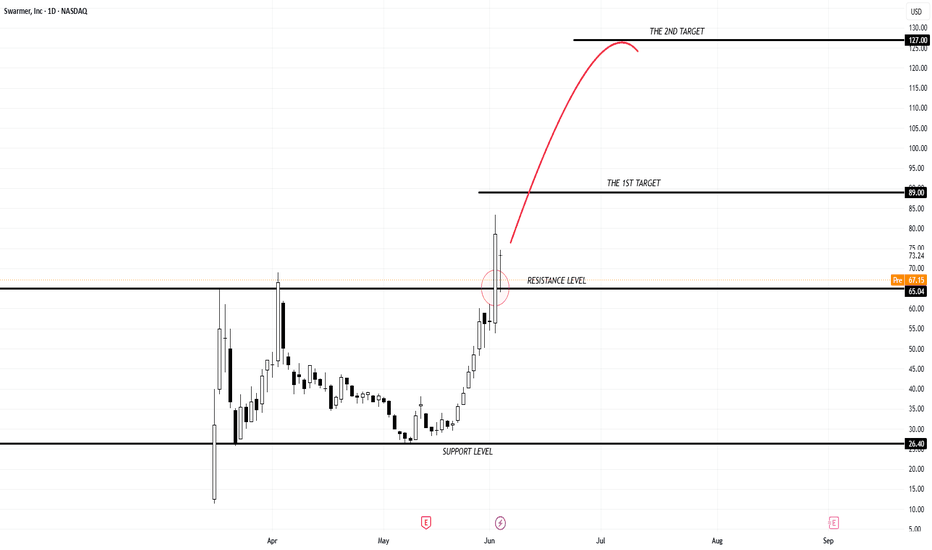
Long 
Short 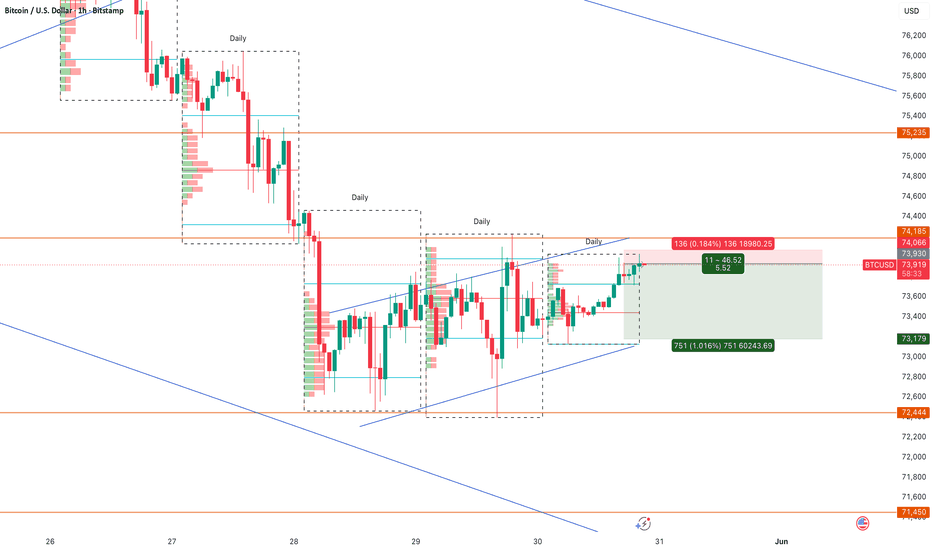
Long 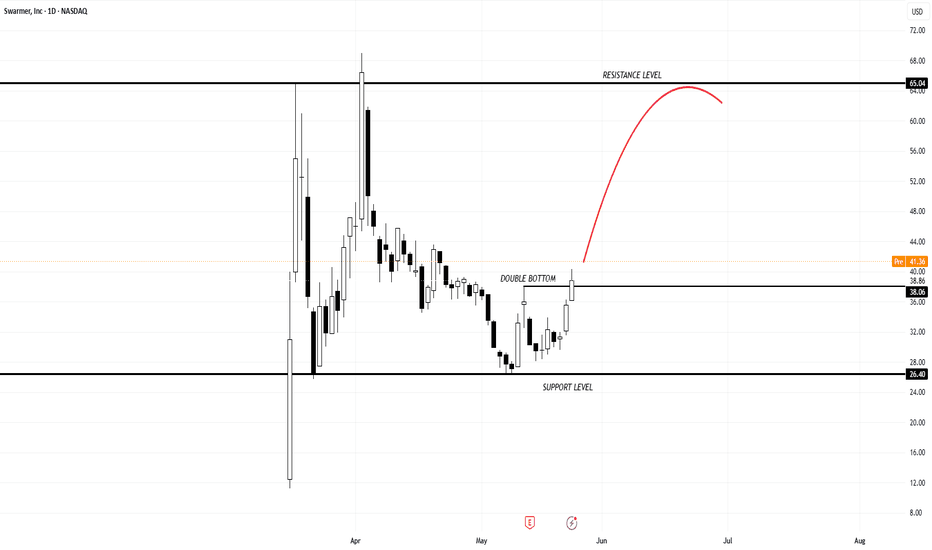
Short 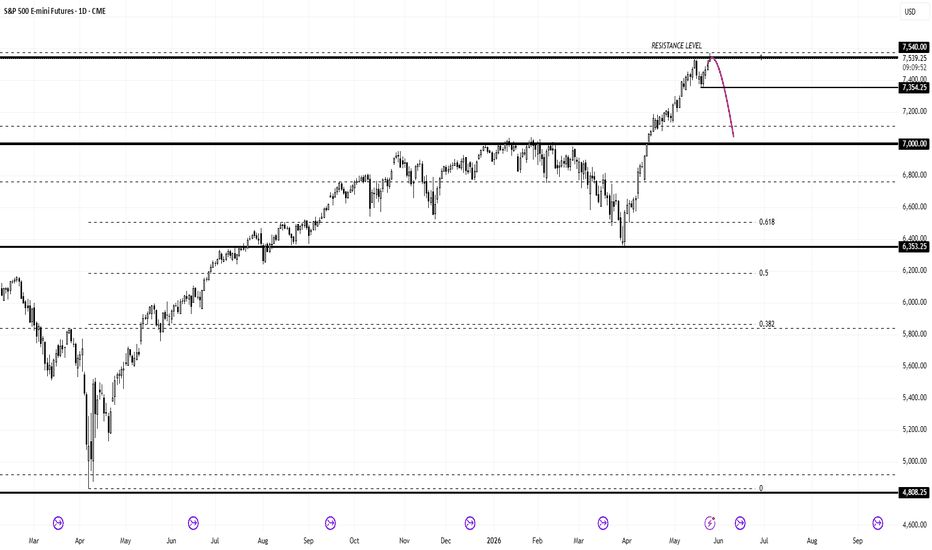
 Long
Long
Bitcoin Weekly Update: Bear Market Rally or Real Reversal?#Bitcoin weekly update:
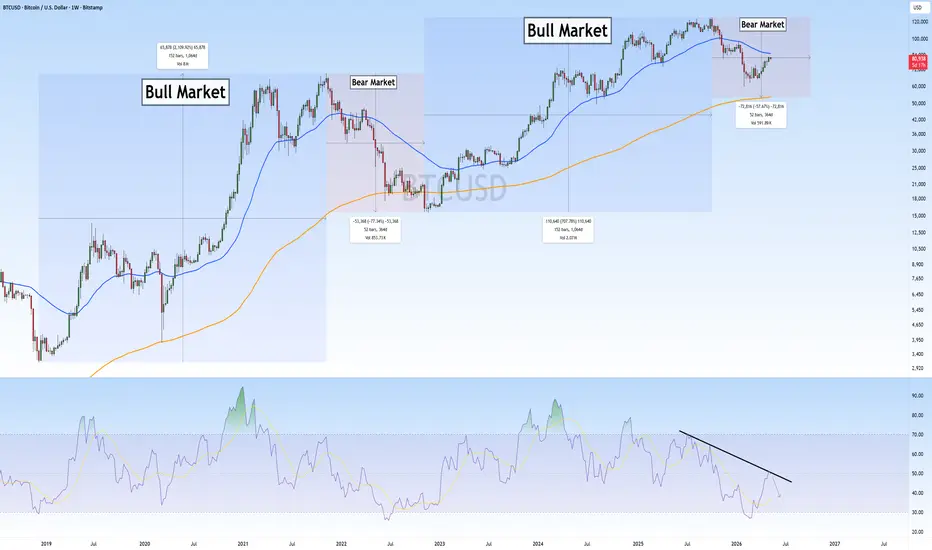
On the weekly timeframe, BTC is trading just below the 50 EMA resistance, a level that has acted as strong resistance during previous bear market phases.
Right now, many traders and your favourite influencer believe the bottom is already in and that BTC is ready for a straight move toward new all-time highs.
But looking at historical cycles, the structure still doesn’t fully support that idea yet.
In past bear markets, BTC has usually spent around a year in the correction phase before a real trend reversal happened. We still haven’t completed that full cycle duration, which suggests there could still be one more major move lower before the market fully resets.
Another important thing is that during previous bear markets, BTC eventually touched the 350 EMA before starting a true bull market recovery. So far, we haven’t seen that happen in this cycle. The 350 EMA is currently sitting around the 53K–54K region, making it a major area to watch if the market weakens again.
Until BTC reclaims key higher timeframe resistance with strong momentum, this still looks more like a bear market rally than the start of a full bull run.
#Bearmarket Short