Harmonic Patterns - First PRZ Touch
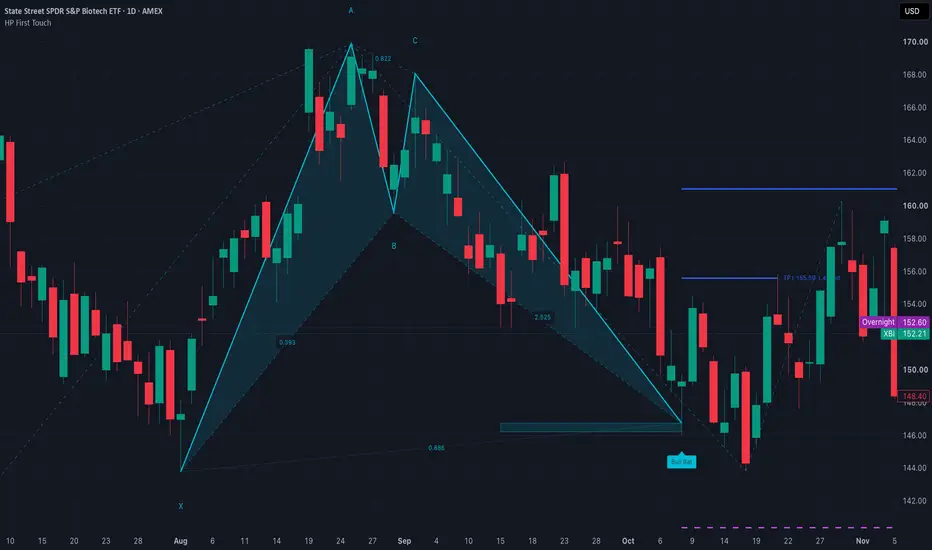
This indicator finds harmonic patterns (Gartley, Bat, Alternate Bat, Butterfly, Crab, Deep Crab and, optionally, AB=CD) using the ratios Scott Carney publishes for them. It signals on the first closed bar whose price reaches the pattern's potential reversal zone (PRZ), without waiting for D to become a confirmed swing. A signal is never moved or deleted because price later went against it. The chart history therefore shows each drawn pattern on the bar that reached its PRZ (for late signals see Timing), failures included. By default, when its stop or its last target trades, or its stop and target lines reach their maximum length, its name label records the outcome in the order the levels traded, for example "Bull Bat: TP1 > SL", and the lines are removed. With "Keep lines" the lines stay, marked hit or void, and no outcome is added to the label. By default ("Show all"), every detected pattern is drawn and alerted on its own, even where several complete in the same zone. The "One per zone" option instead adds such a pattern to the label of an earlier pattern of the same direction whose lines are still running, when its D lies within 1 x ATR(14) (adjustable) of that pattern's PRZ.
How it works
Pattern ratios
B is a retracement of XA, C a retracement of AB, BC is the CD/BC projection range, and D is the defining level. These are the numbers on Carney's pattern diagrams. Every XABCD pattern also needs CD at least as long as AB, because Carney includes an AB=CD in each pattern's definition (for the Bat and the Crab, an equal AB=CD is the stated minimum); for the Gartley he gives 1.0 to 1.27 AB.
The table cannot be edited, so a pattern only gets a name whose ratios it meets. The tooltip on each pattern shows its measured XB, AC, BD, XD and CD/AB next to the published ratios, so you can check every label yourself. The four ratios are linked, so part of a window can be out of reach: a Crab, for example, can only print with B between about 0.49 and 0.618.
Tolerance
Prices never land exactly on a single ratio such as the Gartley's 0.618 B. Each single value is therefore accepted within +/- 0.02 below 1 and within +/- 2% above 1 (the input sets the 0.02). In noise terms this keeps every window about equally strict. Carney gives +/-3% for the Gartley B. Read as 3 points of XA (0.588-0.648), that is a setting of 0.03, so the default 0.598-0.638 is stricter; read as 3% of 0.618, it is about 0.02. The setting matters: on BTCUSD 1h, 0.015, 0.02, 0.025 and 0.03 gave 40, 48, 58 and 65 patterns. Published ranges, such as the Bat's BC 1.618-2.618 or the Gartley's AB=CD 1.0-1.27, are used exactly as printed, because the range already is the allowance. The defining D level is one-sided: the PRZ starts at the level and extends the tolerance beyond it, so a signal never fires before price reaches the level.
What you can change
The stop and targets are reference levels for studying the pattern, not trade instructions.
Timing: what appears when
How to use it
Limitations
What is different here
There are many harmonic indicators on TradingView. I built this one around a single question: what would the pattern have told you at the time? It answers that in five ways:
Credits
The pattern definitions and ratios are Scott M. Carney's published definitions; see his books The Harmonic Trader and Harmonic Trading, Volumes 1-3. The Gartley is named after H. M. Gartley's Profits in the Stock Market (1935), which described the shape without Fibonacci ratios; the ratios used here are Carney's. Carney claims the pattern names (Gartley, Bat, Crab, Butterfly, AB=CD and others) as trademarks. I use them only to identify his published definitions. This script is independent and not affiliated with or endorsed by him. The code is original to this script; it contains no code from other scripts.
For chart analysis and education only. This is not investment advice.
How it works
- Swings. A swing high is a bar higher than the left bars before it and at least as high as the right bars after it (default 2 / 2). Swing lows mirror this. A swing is only known right bars after it prints. Optionally, swings smaller than a percent of price or a multiple of ATR(14) are ignored.
- Legs. X, A, B and C are swings. A swing can pair with any earlier opposite swing, not only with its neighbour, as long as the leg is clean: each point is beyond every bar of its leg, and no bar of the leg breaks the leg's start.
- Ratios. B is measured as a retracement of XA and C as a retracement of AB. D is measured three ways: as a projection of BC (CD/BC), against XA (AD/XA) and against AB (CD/AB). For the AB=CD pattern, D is measured as CD/BC and CD/AB.
- PRZ. Once X-A-B-C qualifies, the PRZ is known before D exists. It is the pattern's defining D level (for example 0.886 XA for the Bat), from the level itself to the tolerance beyond it, kept only where it lies inside the pattern's BC projection range and where CD is at least as long as AB (for the Gartley, 1.0 to 1.27 times AB). If these do not overlap, the setup is dropped.
- Trigger. D is the first closed bar whose low (bullish) or high (bearish) reaches the PRZ while the C-to-D leg is still making new extremes and C has not been broken. If price reaches the PRZ less than 30 bars after X (after A for AB=CD), the pattern is too small and the setup is dropped. D is drawn at the PRZ edge that price reached first, which is normally the defining level itself, so the XD shown at D reads 0.886 for a Bat and 1.618 for a Crab. When the BC or AB=CD limit lies beyond that level, D is drawn at that limit instead, still inside the PRZ. If the bar opened inside the PRZ, D is the open. That is the price a resting limit order at the PRZ would have been filled at.
- Levels. Stop and target lines start at D and end on the bar their level trades. By default ("Collapse into label"), on the bar the stop or the last target trades, or the lines reach their maximum length (50 bars), the pattern's stop and target lines, their labels and its PRZ box are removed and the outcome is added to its name label: "TP1 > SL", "TP1 > TP2", "SL", or "expired" when the lines ended first ("TP1 > expired" after a target). The tooltip then lists each level with its price and the bar it traded on, or "void" for a target the stop ended. A pattern whose levels are still open keeps its lines. "Keep lines" leaves finished lines on the chart instead, with targets that the stop ended marked void.
Pattern ratios
B is a retracement of XA, C a retracement of AB, BC is the CD/BC projection range, and D is the defining level. These are the numbers on Carney's pattern diagrams. Every XABCD pattern also needs CD at least as long as AB, because Carney includes an AB=CD in each pattern's definition (for the Bat and the Crab, an equal AB=CD is the stated minimum); for the Gartley he gives 1.0 to 1.27 AB.
- Gartley: B 0.618, C 0.382-0.886, BC 1.13-1.618, AB=CD 1.0-1.27, D 0.786 XA
- Bat: B 0.382-0.50, C 0.382-0.886, BC 1.618-2.618, D 0.886 XA
- Alternate Bat: B 0.382 or less, C 0.382-0.886, BC 2.0-3.618, D 1.13 XA
- Butterfly: B 0.786, C 0.382-0.886, BC 1.618-2.24, D 1.27 XA
- Crab: B 0.382-0.618, C 0.382-0.886, BC 2.618-3.618, D 1.618 XA
- Deep Crab: B 0.886 (may go deeper, never past X), C 0.382-0.886, BC 2.0-3.618, D 1.618 XA
- AB=CD (off by default): C 0.382-0.886, BC 1.13-2.618, CD equal to AB
The table cannot be edited, so a pattern only gets a name whose ratios it meets. The tooltip on each pattern shows its measured XB, AC, BD, XD and CD/AB next to the published ratios, so you can check every label yourself. The four ratios are linked, so part of a window can be out of reach: a Crab, for example, can only print with B between about 0.49 and 0.618.
Tolerance
Prices never land exactly on a single ratio such as the Gartley's 0.618 B. Each single value is therefore accepted within +/- 0.02 below 1 and within +/- 2% above 1 (the input sets the 0.02). In noise terms this keeps every window about equally strict. Carney gives +/-3% for the Gartley B. Read as 3 points of XA (0.588-0.648), that is a setting of 0.03, so the default 0.598-0.638 is stricter; read as 3% of 0.618, it is about 0.02. The setting matters: on BTCUSD 1h, 0.015, 0.02, 0.025 and 0.03 gave 40, 48, 58 and 65 patterns. Published ranges, such as the Bat's BC 1.618-2.618 or the Gartley's AB=CD 1.0-1.27, are used exactly as printed, because the range already is the allowance. The defining D level is one-sided: the PRZ starts at the level and extends the tolerance beyond it, so a signal never fires before price reaches the level.
What you can change
- Swing size: left / right bars and the optional minimum swing.
- Tolerance, and the minimum and maximum bars from X to D. The minimum (30) is Carney's minimum pattern size. The maximum (300) is a search horizon, not a pattern rule.
- Which patterns are on, for bullish, bearish or both.
- Targets: up to three, each a retracement of the AD leg (defaults 0.382 and 0.618) or of the CD leg, each one switchable.
- Stop: by default at X for the Gartley (Carney: beyond X), at 1.13 XA for the Bat (his "make-or-break" level), and 1 x ATR(14) beyond the PRZ for the other patterns, for which he gives no number. The ATR is the one known before D, from the bar before it. You can instead set an XA level, an ATR multiple beyond the PRZ, or a multiple of CD.
- Drawing: number of patterns kept (5), overlapping patterns (show all, or one per zone with its ATR width), fills, ratio labels (on the newest pattern only, on all, or off), PRZ box, possible D zones, line length, finished levels (collapse into the label, or keep the lines) and colours.
The stop and targets are reference levels for studying the pattern, not trade instructions.
Timing: what appears when
- All detection runs on closed bars only. A signal and its alert appear at the close of the bar that reached the PRZ (late signals: on C's confirmation bar), and are never moved or re-timed. Two things change later by default: when the pattern's levels finish, the outcome is added to the label and its stop and target lines and PRZ box are removed (with Keep lines they stay, marked hit or void); and with the default ratio labels, a pattern's ratio labels are removed when a newer pattern is drawn. With One per zone, a later pattern in the same zone also adds its name, marked with the bars since this signal, to the label and its details to the tooltip.
- X, A, B and C are drawn on their own bars, but each one only appears once it is confirmed, right bars later. As with any swing-based tool, these points are plotted in the past.
- If price reached the PRZ before C was confirmed, D is drawn on the true touch bar, up to right - 1 bars before the signal. The signal itself comes on C's confirmation bar and is labelled "late", and the tooltip and alert say if the stop or a target had already traded by then.
- Targets count from the bar after D. The stop also counts on the D bar itself, where it can only have traded after the entry, and the tooltip and alert flag that case. If the stop and a target trade in the same bar, the stop counts.
- D is the PRZ price. When you act on the alert you get roughly the bar's close instead, so the tooltip and the alert show that close too.
- When several drawn patterns complete on the same bar and direction, they share one name label. Only the first gets letters, fills, ratio labels, the PRZ box and stop and target lines. The others are drawn as a thin outline, their levels and flags are in the tooltip, and the label notes when one's stop has traded. The outcome added to the label is the first pattern's. With One per zone each pattern is checked on its own, so one of them can join an earlier label while the others are drawn.
- Dashed "possible D" boxes show where setups that are still forming could complete. They are redrawn on every bar and disappear when a setup fails. They are not signals.
How to use it
- Use a standard candle or bar chart. On Heikin Ashi, Renko and other non-standard charts the prices are synthetic, so the script stops with an error.
- For alerts, create an alert with the condition "Any alert() function call". Each closed bar sends at most one message. It lists every pattern drawn on that bar with the symbol, timeframe, D, PRZ, close, stop and targets with their reward-to-risk, plus any late or already-traded note. TradingView alerts only fire on live bars.
- Hover over a pattern's name label to see its dates, prices, ratios, PRZ and levels, and, by default, once its levels have finished, the bar each one traded on.
Limitations
- Signals are rare. With the defaults, the 6,000
 BTCUSD 1h bars from 2026-03-03 to 2026-11-08 contain 48 patterns on 43 bars, so the part of a chart you are looking at can easily show none. Switching AB=CD on adds about twice as many again.
- Harmonic shapes also appear in random data. On BTCUSD 1h with the order of its candles shuffled (each candle's moves kept, prices re-linked), ten shuffles gave 42.5 patterns on average (32 to 54) against 48 on the real series. Treat a pattern as a place to watch, not as a forecast.
- Only the newest patterns stay drawn: 5 by default to keep the chart readable, up to 30 because of TradingView's drawing limits. Older ones are deleted for those reasons only, never because of how they turned out.
- The earliest patterns depend on where your chart's history starts, so they can differ between accounts and plans.
- If a bar opens beyond the whole PRZ (a gap), the PRZ price never traded, so the setup is dropped without a signal.
- Only the first touch is signalled. A later retest of the same PRZ is not, and neither are Carney's 1.27 and 1.618 AB=CD alternates, because CD always reaches 1.0 x AB first.
- Shark, 5-0, Cypher and Three Drives are not included. They are measured differently from the XABCD patterns above.
- This is a pattern detector, not a strategy. I make no win-rate or backtest claims.
What is different here
There are many harmonic indicators on TradingView. I built this one around a single question: what would the pattern have told you at the time? It answers that in five ways:
- It signals when price first reaches the PRZ on a closed bar, not after D has been confirmed as a swing. A swing at D is only confirmed after price has already turned, so a history drawn that way leaves out the patterns that ran straight through the PRZ.
- The PRZ is worked out from X, A, B and C before D exists, and D prints where the PRZ begins, normally at the defining level itself, instead of at the edge of a tolerance band.
- It uses one fixed ratio table, taken from the published pattern definitions, and shows the measured ratios for every pattern it draws.
- By default, each name label records the order in which its first pattern's stop and targets traded, or that its lines expired first. Late signals and levels that had already traded are always flagged.
- Legs can join swings that are not neighbours, as long as each leg is clean.
Credits
The pattern definitions and ratios are Scott M. Carney's published definitions; see his books The Harmonic Trader and Harmonic Trading, Volumes 1-3. The Gartley is named after H. M. Gartley's Profits in the Stock Market (1935), which described the shape without Fibonacci ratios; the ratios used here are Carney's. Carney claims the pattern names (Gartley, Bat, Crab, Butterfly, AB=CD and others) as trademarks. I use them only to identify his published definitions. This script is independent and not affiliated with or endorsed by him. The code is original to this script; it contains no code from other scripts.
For chart analysis and education only. This is not investment advice.

Penafian
Maklumat dan penerbitan adalah tidak bertujuan, dan tidak membentuk, nasihat atau cadangan kewangan, pelaburan, dagangan atau jenis lain yang diberikan atau disahkan oleh TradingView. Baca lebih dalam Terma Penggunaan.
Penafian
Maklumat dan penerbitan adalah tidak bertujuan, dan tidak membentuk, nasihat atau cadangan kewangan, pelaburan, dagangan atau jenis lain yang diberikan atau disahkan oleh TradingView. Baca lebih dalam Terma Penggunaan.