OPEN-SOURCE SCRIPT
Support and Resistance Zones [NJ]
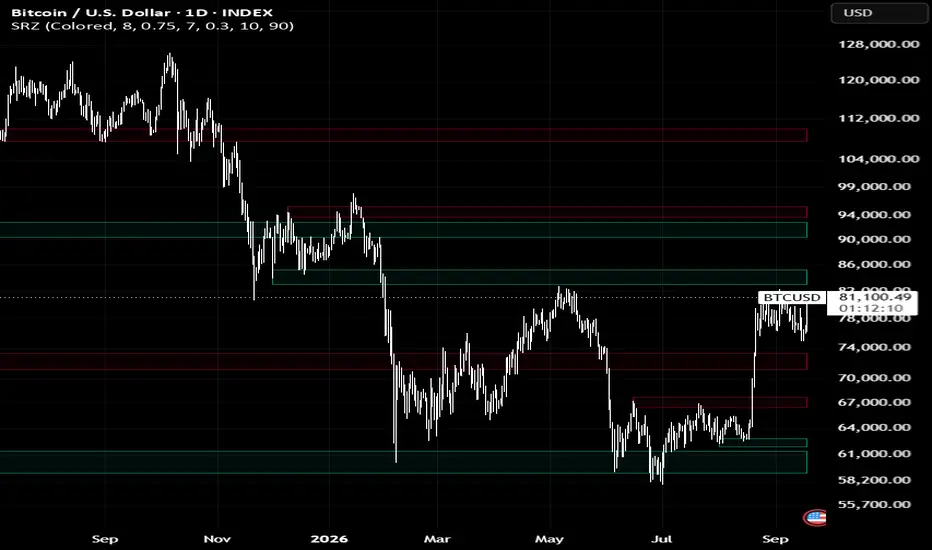
✧ OVERVIEW ✧
Indicator identifies potential support and resistance zones using confirmed swing highs and lows.
Zones are formed when two swing points occur near the same price level within an ATR-based tolerance and the selected minimum and maximum distance between touches.
Confirmed zones extend forward to the current bar and can be used as reference areas for potential reversals, breakouts, and general market structure analysis.

✧ SETTINGS ✧
Color Mode
Switches between colored support/resistance zones and a neutral white visualization.
Maximum Zones Shown
Controls the maximum number of support and resistance zones displayed on the chart.
Minimum Zone Distance
Controls the minimum distance required between existing and newly detected zones, measured in ATR.
Swing Strength
Controls swing sensitivity. Lower values detect smaller and more frequent swings, while higher values focus on stronger and less frequent swings.
Zone Tolerance
Controls how close two swing points must be to form the same support or resistance zone. Higher values allow a wider price difference.
Minimum Bars Between Touches
Sets the minimum number of bars required between the two swing points forming a zone.
Maximum Bars Between Touches
Sets the maximum number of bars allowed between the two swing points forming a zone.
✧ HOW IT WORKS ✧
Swing Detection
The indicator identifies confirmed swing highs and swing lows using pivot-based detection.
Zone Formation
A resistance zone is formed when two swing highs occur near the same price level.
A support zone is formed when two swing lows occur near the same price level.
The two swing points must fall within the selected ATR-based tolerance and within the selected minimum and maximum number of bars between touches.
Zone Placement
The center of each zone is calculated from the average price of the two matching swing points.
The width of the zone adapts to market volatility using ATR.
Zone Separation
Before a new zone is displayed, its distance from existing support and resistance zones is checked.
If the new zone is closer than the selected minimum zone distance, it is not displayed. This helps prevent multiple zones from clustering around essentially the same price level.
✧ VISUALIZATION ✧
Resistance zones are displayed in red and support zones in green when using Colored mode.
Neutral mode displays both types in white.
Once confirmed, each zone is drawn retrospectively from the first swing point used to form it and extends forward to the current bar.
Because swing highs and lows require future bars to be confirmed, the beginning of a zone can appear several bars before the indicator could have identified the completed structure in real time.
✧ USAGE ✧
The detected zones can provide market structure context for:
Support and resistance
Potential reversals
Breakout and retest analysis
Entry and exit areas
Stop-loss and take-profit placement
Confluence with other technical analysis
The zones represent areas rather than exact price levels and are best used alongside other forms of analysis rather than as standalone entry or exit signals.
Indicator identifies potential support and resistance zones using confirmed swing highs and lows.
Zones are formed when two swing points occur near the same price level within an ATR-based tolerance and the selected minimum and maximum distance between touches.
Confirmed zones extend forward to the current bar and can be used as reference areas for potential reversals, breakouts, and general market structure analysis.
✧ SETTINGS ✧
Color Mode
Switches between colored support/resistance zones and a neutral white visualization.
Maximum Zones Shown
Controls the maximum number of support and resistance zones displayed on the chart.
Minimum Zone Distance
Controls the minimum distance required between existing and newly detected zones, measured in ATR.
Swing Strength
Controls swing sensitivity. Lower values detect smaller and more frequent swings, while higher values focus on stronger and less frequent swings.
Zone Tolerance
Controls how close two swing points must be to form the same support or resistance zone. Higher values allow a wider price difference.
Minimum Bars Between Touches
Sets the minimum number of bars required between the two swing points forming a zone.
Maximum Bars Between Touches
Sets the maximum number of bars allowed between the two swing points forming a zone.
✧ HOW IT WORKS ✧
Swing Detection
The indicator identifies confirmed swing highs and swing lows using pivot-based detection.
Zone Formation
A resistance zone is formed when two swing highs occur near the same price level.
A support zone is formed when two swing lows occur near the same price level.
The two swing points must fall within the selected ATR-based tolerance and within the selected minimum and maximum number of bars between touches.
Zone Placement
The center of each zone is calculated from the average price of the two matching swing points.
The width of the zone adapts to market volatility using ATR.
Zone Separation
Before a new zone is displayed, its distance from existing support and resistance zones is checked.
If the new zone is closer than the selected minimum zone distance, it is not displayed. This helps prevent multiple zones from clustering around essentially the same price level.
✧ VISUALIZATION ✧
Resistance zones are displayed in red and support zones in green when using Colored mode.
Neutral mode displays both types in white.
Once confirmed, each zone is drawn retrospectively from the first swing point used to form it and extends forward to the current bar.
Because swing highs and lows require future bars to be confirmed, the beginning of a zone can appear several bars before the indicator could have identified the completed structure in real time.
✧ USAGE ✧
The detected zones can provide market structure context for:
Support and resistance
Potential reversals
Breakout and retest analysis
Entry and exit areas
Stop-loss and take-profit placement
Confluence with other technical analysis
The zones represent areas rather than exact price levels and are best used alongside other forms of analysis rather than as standalone entry or exit signals.
Skrip sumber terbuka
Dalam semangat TradingView sebenar, pencipta skrip ini telah menjadikannya sumber terbuka, jadi pedagang boleh menilai dan mengesahkan kefungsiannya. Terima kasih kepada penulis! Walaupuan anda boleh menggunakan secara percuma, ingat bahawa penerbitan semula kod ini tertakluk kepada Peraturan Dalaman.

Penafian
Maklumat dan penerbitan adalah tidak bertujuan, dan tidak membentuk, nasihat atau cadangan kewangan, pelaburan, dagangan atau jenis lain yang diberikan atau disahkan oleh TradingView. Baca lebih dalam Terma Penggunaan.
Skrip sumber terbuka
Dalam semangat TradingView sebenar, pencipta skrip ini telah menjadikannya sumber terbuka, jadi pedagang boleh menilai dan mengesahkan kefungsiannya. Terima kasih kepada penulis! Walaupuan anda boleh menggunakan secara percuma, ingat bahawa penerbitan semula kod ini tertakluk kepada Peraturan Dalaman.
Penafian
Maklumat dan penerbitan adalah tidak bertujuan, dan tidak membentuk, nasihat atau cadangan kewangan, pelaburan, dagangan atau jenis lain yang diberikan atau disahkan oleh TradingView. Baca lebih dalam Terma Penggunaan.