PROTECTED SOURCE SCRIPT
MACD MTF Dashboard
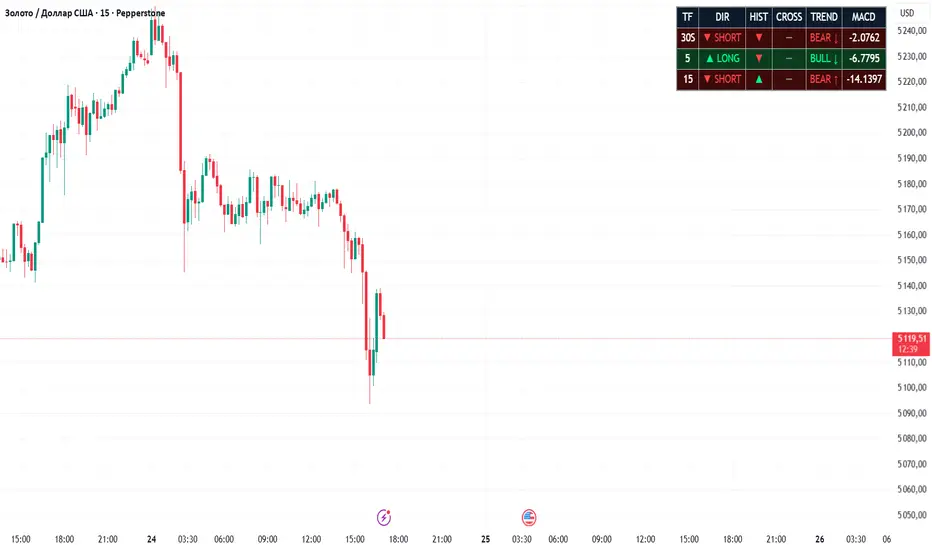
MACD Multi-Timeframe Dashboard — Indicator Description
Overview
The MACD Multi-Timeframe Dashboard is a compact table-based indicator that displays MACD data across up to 8 timeframes simultaneously — without cluttering your chart with multiple MACD panels. Designed for traders who make decisions based on multi-timeframe confluence, it allows you to instantly see the market direction, momentum, and cross signals across all key timeframes in one place.
How It Works
The indicator calculates standard MACD (Moving Average Convergence Divergence) for each selected timeframe and displays the results in a clean, color-coded table directly on your chart.
Each row represents one timeframe and shows 5 key values:
TF — The timeframe being analyzed (e.g. 1m, 5m, 15m, 1H, 4H, D)
DIR — Current MACD direction:
▲ LONG — MACD line is above the Signal line (bullish)
▼ SHORT — MACD line is below the Signal line (bearish)
HIST — Histogram momentum:
▲ — Histogram is growing compared to previous bar
▼ — Histogram is shrinking compared to previous bar
CROSS — Cross signal (appears only on the bar where crossover occurs):
▲ BULL — MACD crossed above Signal line (bullish crossover)
▼ BEAR — MACD crossed below Signal line (bearish crossover)
— — No cross on current bar
TREND — Combined trend label:
BULL ↑ — Bullish direction + histogram growing (strongest long signal)
BULL ↓ — Bullish direction + histogram shrinking (weakening long)
BEAR ↓ — Bearish direction + histogram falling (strongest short signal)
BEAR ↑ — Bearish direction + histogram rising (weakening short)
MACD — Raw numerical value of the MACD line
Color Logic
Green background — MACD is above Signal (bullish timeframe)
Red background — MACD is below Signal (bearish timeframe)
Yellow — Bullish crossover just occurred
Orange — Bearish crossover just occurred
Settings
Fast / Slow / Signal lengths — Standard MACD parameters (default 12/26/9)
Number of timeframes — Display 1 to 8 timeframes (empty rows are hidden)
Timeframe inputs — Each TF is fully customizable
Table position — Top Right / Top Left / Bottom Right / Bottom Left
Text size — Tiny / Small / Normal / Large
How to Use
Multi-timeframe confluence: If 1m, 5m, and 15m all show SHORT with BEAR ↓ trend — high-probability short setup on lower timeframes.
Trend filter: Use higher timeframes (1H, 4H, D) as directional bias. Trade only in the direction of the higher TF MACD.
Cross alert: CROSS column lights up only on the exact bar of the crossover — use it as a trigger signal combined with DIR and TREND confirmation.
Momentum shift: Watch HIST column — if DIR shows LONG but HIST shows ▼, the bullish momentum is weakening and reversal may be near.
Example workflow:
4H = SHORT → bias is bearish
15m = SHORT, BEAR ↓ → confirms direction
5m CROSS = ▼ BEAR → entry trigger
1m = SHORT → execute short on scalp timeframe
Overview
The MACD Multi-Timeframe Dashboard is a compact table-based indicator that displays MACD data across up to 8 timeframes simultaneously — without cluttering your chart with multiple MACD panels. Designed for traders who make decisions based on multi-timeframe confluence, it allows you to instantly see the market direction, momentum, and cross signals across all key timeframes in one place.
How It Works
The indicator calculates standard MACD (Moving Average Convergence Divergence) for each selected timeframe and displays the results in a clean, color-coded table directly on your chart.
Each row represents one timeframe and shows 5 key values:
TF — The timeframe being analyzed (e.g. 1m, 5m, 15m, 1H, 4H, D)
DIR — Current MACD direction:
▲ LONG — MACD line is above the Signal line (bullish)
▼ SHORT — MACD line is below the Signal line (bearish)
HIST — Histogram momentum:
▲ — Histogram is growing compared to previous bar
▼ — Histogram is shrinking compared to previous bar
CROSS — Cross signal (appears only on the bar where crossover occurs):
▲ BULL — MACD crossed above Signal line (bullish crossover)
▼ BEAR — MACD crossed below Signal line (bearish crossover)
— — No cross on current bar
TREND — Combined trend label:
BULL ↑ — Bullish direction + histogram growing (strongest long signal)
BULL ↓ — Bullish direction + histogram shrinking (weakening long)
BEAR ↓ — Bearish direction + histogram falling (strongest short signal)
BEAR ↑ — Bearish direction + histogram rising (weakening short)
MACD — Raw numerical value of the MACD line
Color Logic
Green background — MACD is above Signal (bullish timeframe)
Red background — MACD is below Signal (bearish timeframe)
Yellow — Bullish crossover just occurred
Orange — Bearish crossover just occurred
Settings
Fast / Slow / Signal lengths — Standard MACD parameters (default 12/26/9)
Number of timeframes — Display 1 to 8 timeframes (empty rows are hidden)
Timeframe inputs — Each TF is fully customizable
Table position — Top Right / Top Left / Bottom Right / Bottom Left
Text size — Tiny / Small / Normal / Large
How to Use
Multi-timeframe confluence: If 1m, 5m, and 15m all show SHORT with BEAR ↓ trend — high-probability short setup on lower timeframes.
Trend filter: Use higher timeframes (1H, 4H, D) as directional bias. Trade only in the direction of the higher TF MACD.
Cross alert: CROSS column lights up only on the exact bar of the crossover — use it as a trigger signal combined with DIR and TREND confirmation.
Momentum shift: Watch HIST column — if DIR shows LONG but HIST shows ▼, the bullish momentum is weakening and reversal may be near.
Example workflow:
4H = SHORT → bias is bearish
15m = SHORT, BEAR ↓ → confirms direction
5m CROSS = ▼ BEAR → entry trigger
1m = SHORT → execute short on scalp timeframe
Skrip dilindungi
Skrip ini diterbitkan sebagai sumber tertutup. Akan tetapi, anda boleh menggunakannya secara bebas dan tanpa apa-apa had – ketahui lebih di sini.

Penafian
Maklumat dan penerbitan adalah tidak bertujuan, dan tidak membentuk, nasihat atau cadangan kewangan, pelaburan, dagangan atau jenis lain yang diberikan atau disahkan oleh TradingView. Baca lebih dalam Terma Penggunaan.
Skrip dilindungi
Skrip ini diterbitkan sebagai sumber tertutup. Akan tetapi, anda boleh menggunakannya secara bebas dan tanpa apa-apa had – ketahui lebih di sini.
Penafian
Maklumat dan penerbitan adalah tidak bertujuan, dan tidak membentuk, nasihat atau cadangan kewangan, pelaburan, dagangan atau jenis lain yang diberikan atau disahkan oleh TradingView. Baca lebih dalam Terma Penggunaan.