OPEN-SOURCE SCRIPT
Telah dikemas kini KNN Market Regime Engine [Dots3Red]
█ OVERVIEW
Most market regime tools work in a pretty simple way: we set a threshold and call it a day. ADX above 25? Trending. Below 20? Ranging.
But that threshold is basically just our assumption baked into code. It doesn’t adapt, it doesn’t learn, and it’s treated the same whether we’re looking at Bitcoin, EUR/USD, or any other market — even though they behave completely differently.
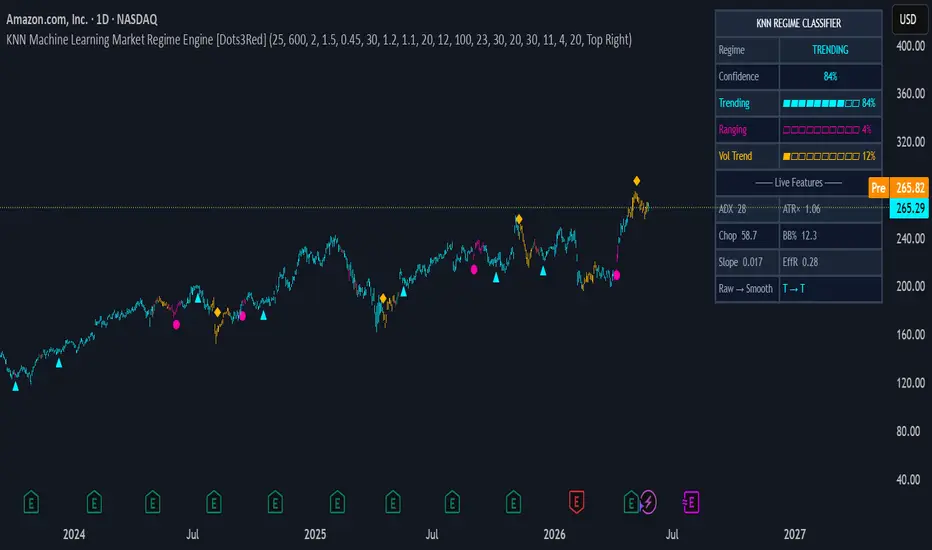
This script takes a different approach. It uses a K-Nearest Neighbors (KNN) machine learning algorithm to estimate the probability that the current market is in one of three regimes: Trending, Ranging, or Volatile Trend. Rather than comparing today's readings against a fixed number, it searches the past 700 bars for the moments that looked most like right now - and asks what the market did after each of those moments. The result is a live probability for each regime, not a hard categorical label.
The output is three things simultaneously:
█ THE FOUR REGIMES
🔵 TRENDING — price is moving directionally with efficiency. Momentum strategies belong here. Mean reversion strategies get punished here.
🟣 RANGING — price is oscillating between levels with no net directional movement. Mean reversion strategies and fade-the-extreme setups have edge here. Trend-following generates whipsaws.
🟡 VOLATILE TREND — price is trending and ATR has expanded sharply beyond its baseline. This captures earnings gaps, macro shocks, and post-breakout expansion. It is a distinct fourth state — not simply "a strong trend." Reduce size or trail very tightly.
⬛ UNCERTAIN — the dominant probability did not clear the minimum confidence threshold. The market's character is genuinely ambiguous. The best action is observation, not engagement.
█ HOW IT WORKS — THE FULL PIPELINE
Step 1 — Six features, measured every bar
Each bar is described by six measurements, each capturing a different dimension of market character:
• ADX — trend strength. Not direction — only how strongly price is committed to any direction.
• ATR ratio — current ATR divided by its own long-term average. Measures whether volatility is elevated or compressed relative to its own history.
• Choppiness Index — measures how much of the price movement was wasted going sideways. Near 100 = pure chop. Near 38 = perfectly directional.
• Bollinger Band width — how expanded or compressed the bands are relative to price. A compression often precedes volatile expansion.
• Normalized slope — linear regression slope over N bars, divided by ATR. A scale-free measure of directional momentum.
• Kaufman Efficiency Ratio — how directly did price move from A to B? If price traveled 100 points total but only net-moved 20, ER is 0.20. High ER = trending cleanly. Low ER = zigzagging.
Step 2 — Z-score normalization
ADX runs 0–100. ATR ratio runs 0.5–3.0. BB width might be 0.01–0.08 on forex. Using raw values in a distance calculation means the largest-scale feature dominates by sheer magnitude. All six features are standardized: z = (value − rolling mean) / rolling stdev. This puts every feature on equal footing — a reading of +2.0 means "two standard deviations above normal" on any feature. Critically, the mean and stdev are computed on prior bars only (src[1] offset), which eliminates look-ahead bias from the normalization step.
Step 3 — Labeling historical bars
For every historical bar, the script evaluates what happened over the following Forward Bars window:
• If the net price move exceeded Trend Threshold × average ATR over the window → labeled TRENDING (1)
• If the ATR ratio exceeded Volatility Threshold → labeled VOLATILE TREND (3)
• If trending AND volatile simultaneously → labeled VOLATILE TREND (3), because risk context takes priority
• Otherwise → labeled RANGING (2)
This label is only ever read at an offset of at least Forward Bars bars into the past, so the current bar carries no label — there is no look-ahead in the training data.
Step 4 — KNN search and Gaussian-weighted voting
On each bar, the algorithm scans the historical window (default 700 bars) and computes the Minkowski distance between today's six Z-scored features and every historical bar's six features. The K nearest matches are selected. Closer neighbors receive exponentially higher voting weight via a Gaussian kernel: w = exp(−d² / 2σ²). This means a bar at distance 0.1 vastly outweighs one at distance 0.5. The votes produce three probabilities — P(trending), P(ranging), P(volatile trend) — that always sum to 1.
Step 5 — Three-stage noise filtering
A single KNN output can flicker bar to bar. Three filters eliminate this:
• Mode filter — selects the most common regime over the last smooth_len bars. Removes 1-3 bar flickers entirely.
• Confirmation filter — the smoothed regime must hold steady for confirm_bars consecutive bars before being accepted. Kills false starts.
• Signal gap — regime change markers only appear once per signal_gap bars minimum, and only when the dominant probability exceeds 65%. This eliminates cluttered charts entirely.
█ DESIGN DECISIONS — WHAT WAS INITIALLY, WHAT CHANGED AND WHY
From 3 regimes to 4
The first idea used three regimes with a simple override: if volatility was high, VOLATILE replaced TRENDING regardless of whether price was actually moving directionally. Testing on stocks showed this caused problems — an earnings-day spike during a clear uptrend was collapsing the trend signal entirely. We realized volatile trending markets are qualitatively different from volatile ranging markets. A fast trend during an OPEC announcement is not the same as a gap-down in a sideways consolidation. VOLATILE TREND became its own regime, and the distinction turned out to be the most practically useful change in the entire script.
From stride = fwd_bars to stride = 3
The early idea for the script we had sampled the training window with a stride equal to Forward Bars (30 by default). This gave roughly 23 training samples — barely enough for KNN to make a meaningful comparison. Reducing the stride to 3 gives approximately 230 samples. The regime classification became dramatically more stable and consistent, especially in quieter markets where the 23-sample version frequently returned UNCERTAIN. The trade-off is slightly more computation, which Pine handles comfortably within its limits.
From a single volatile threshold to a combined trend + volatile check
Originally we labeled VOLATILE based purely on ATR ratio exceeding a threshold. This correctly flagged high-volatility periods but was labeling slow low-ATR trends as RANGING instead of TRENDING during prolonged low-volatility bull markets. The label logic was reworked to check directionality and volatility independently and then combine them: a trending move is TRENDING unless ATR is also elevated, in which case it becomes VOLATILE TREND. This made the label logic honest about what the market was actually doing.
The Efficiency Ratio addition
The original five features (ADX, ATR ratio, Choppiness, BB width, Slope) left a gap: two markets can have identical ADX and slope but very different directional efficiency — one moves in a clean staircase, the other zigzags the same distance. Kaufman's Efficiency Ratio fills this gap. ER = 0.85 on a bar means 85% of all price movement went in the net direction. ER = 0.20 means price was thrashing around and barely net-moved. It proved particularly valuable for distinguishing true trending from noisy ranging in crypto and high-beta stocks.
The regime change marker clutter problem
Early testing produced charts covered in triangles, circles, and diamonds — a new marker on almost every regime flicker. Three parameters were added to solve this: the mode filter, the confirmation bars requirement, and the signal gap. Together they ensure a marker only appears when (a) the majority of recent bars agree on the new regime, (b) it has held for at least N bars, and (c) the KNN confidence is above 65%. The result is 2–6 meaningful markers per year on a daily chart rather than dozens of noisy ones.
█ WHAT YOU SEE ON THE CHART
█ SETTINGS REFERENCE
🧠 KNN Engine
• K Neighbors — how many historical bars vote. Lower = faster reaction, higher = more stable. Default 25.
• Lookback Window — how many bars to search for neighbors. Larger = more training data. Default 700.
• Minkowski p — distance exponent. 1 = Manhattan (robust to outliers), 2 = Euclidean (standard). Default 2.
• Gaussian bandwidth — how steeply neighbor weight falls with distance. Lower = only the closest neighbors matter. Default 1.5.
• Minimum confidence — probability threshold below which the regime shows as UNCERTAIN. Default 0.45.
🏷️ Labeling
• Forward bars — how many bars ahead define a historical bar's regime label. Match your typical hold time. Default 30.
• Trend threshold — net move must exceed this × avg ATR to label TRENDING. Lower = more bars labeled trending. Default 1.2.
• Volatility threshold — ATR ratio must exceed this to label VOLATILE TREND. Higher = only extreme events qualify. Default 1.5.
📐 Features
• ADX Length — period for the directional movement index. Longer = smoother. Default 20.
• ATR Length — period for average true range. Default 14.
• ATR Baseline — SMA period for the ATR ratio denominator. Longer = more stable baseline. Default 100.
• Choppiness / BB / Slope lengths — feature calculation periods. All default to 20–30.
• Efficiency Ratio Length — Kaufman ER lookback. Default 30.
🧹 Filtering
• Regime Smoothing Lookback — mode filter window. Higher = fewer false regime changes. Default 11.
• Bars to confirm regime — consecutive bars required before a new regime is accepted. Default 4.
• Min bars between signals — minimum spacing between regime change markers. Default 20.
█ SETTINGS BY ASSET CLASS
📈 Large-cap stocks — daily (AMZN, AAPL, NVDA)
Stocks trend slowly over weeks to months, with sharp one-day volatility spikes on earnings. All feature lengths should be longer to resolve the slower regime pace.
• Forward bars: 20–30 | Trend threshold: 0.8–1.2 | Volatility threshold: 2.0–2.5
• ATR Baseline: 100 | ADX / Chop / Slope lengths: 20 | BB length: 30 | EffR: 30
• Smoothing: 11 | Confirm bars: 4–5 | Signal gap: 20
• Note: use 0.8 trend threshold for slow defensive stocks (JNJ, KO), 1.2 for high-beta tech (NVDA, TSLA)
₿ Crypto — daily (BTC, ETH, large caps)
Crypto regimes flip in days, not months. ATR is 3–7× higher than stocks. Shorter windows, lower thresholds, less smoothing.
• Forward bars: 10–14 | Trend threshold: 1.5–2.5 | Volatility threshold: 1.5–2.0
• ATR Baseline: 50–70 | All feature lengths: 14 | EffR: 14–20
• Smoothing: 5–7 | Confirm bars: 2–3 | Signal gap: 7–10
• Note: for altcoins use trend threshold 2.0–2.5; for BTC use 1.5–2.0
💱 Forex — daily (EUR/USD, GBP/USD, USD/JPY)
Forex trends are driven by central bank divergence and last months. Daily ATR is tiny (0.4–0.7% of price). Everything needs to be longer and slower.
• Forward bars: 30–45 | Trend threshold: 0.6–0.8 | Volatility threshold: 2.5–3.0
• ATR Baseline: 120–150 | ADX length: 20–25 | Slope / EffR: 40–50
• Smoothing: 15–21 | Confirm bars: 5–7 | Signal gap: 30–45
• Note: exotic pairs (USD/TRY, USD/ZAR) behave like crypto — use crypto settings instead
🛢️ Commodities — daily (Gold XAU, Oil WTI)
Gold is slow and stable like equities. Oil is fast and event-driven like crypto. Use different profiles.
• Gold: Forward bars 20, Trend 0.8, Vol 2.5, ATR Base 100, Smooth 11, Confirm 4, Gap 20
• Oil: Forward bars 15, Trend 1.2, Vol 2.0, ATR Base 70, Smooth 7, Confirm 2–3, Gap 10
• Note: OPEC events and geopolitical shocks will correctly fire VOLATILE TREND on oil — this is intended behavior
🌐 Indices — daily (SPX, NDX, DAX)
Indices are the most regime-stable asset class. They trend 65–75% of the time and have the cleanest feature signals of any asset.
• Forward bars: 20–30 | Trend threshold: 0.8–1.0 | Volatility threshold: 2.0–2.5
• ATR Baseline: 120 | ADX length: 20 | Smoothing: 11–15 | Confirm bars: 4–5 | Signal gap: 20–30
• Note: NDX is ~30% more volatile than SPX — use trend threshold 1.0 for NDX, 0.8 for SPX
EXAMPLE

█ HOW TO USE WITH OTHER INDICATORS
This script does not generate buy or sell signals. It tells you which type of strategy has edge right now. The intended workflow:
1 — Add your momentum or mean reversion indicator alongside this one.
2 — Only take momentum / trend-following entries when the background is cyan (TRENDING).
3 — Only take mean reversion / fade entries when the background is magenta (RANGING).
4 — Reduce position size or step aside entirely when the background is amber (VOLATILE TREND).
5 — Do nothing when there is no background color — the regime is UNCERTAIN.
Used this way, the classifier acts as a strategy mode selector rather than a signal generator. It is the foundation of a multi-strategy system where the same chart hosts different logic depending on detected conditions.
█ LIMITATIONS
• KNN is a lazy learner — it reflects patterns in its training window. If the current market regime has no historical analog in the lookback window (e.g. a once-in-a-decade crash), the classifier will misclassify or return UNCERTAIN.
• The script requires a warm-up period equal to Lookback Window + Forward Bars bars before producing output. On instruments with limited history this may delay the first valid reading.
• Computation scales with window size and stride. Very large windows (2000+) may slow chart rendering on lower-end machines.
• The reversion probability reflects historical frequency, not a guarantee of future behavior. All market regimes can and do fail.
Human vs Machine🧠vs 🤖
And most importantly, checking the chart with the HUMAN EYE is different from using the raw ML KNN method - something we agreed on checking the charts, as we, traders-developers, had different opinions of the market regime for an asset price. But the Script might yield results we can all agree upon.
█ DISCLAIMER
This indicator is a decision-support tool, not a trading system. It does not constitute financial advice. Past regime patterns do not guarantee future behavior. Always apply proper risk management.
Algorithm: K-Nearest Neighbors (KNN)
Distance metric: Minkowski Distance (p=2, Euclidean default)
Kernel: Gaussian (distance-weighted voting)
Normalization: Z-Score (look-ahead free)
Regimes: Trending | Ranging | Volatile Trend | Uncertain
Most market regime tools work in a pretty simple way: we set a threshold and call it a day. ADX above 25? Trending. Below 20? Ranging.
But that threshold is basically just our assumption baked into code. It doesn’t adapt, it doesn’t learn, and it’s treated the same whether we’re looking at Bitcoin, EUR/USD, or any other market — even though they behave completely differently.
This script takes a different approach. It uses a K-Nearest Neighbors (KNN) machine learning algorithm to estimate the probability that the current market is in one of three regimes: Trending, Ranging, or Volatile Trend. Rather than comparing today's readings against a fixed number, it searches the past 700 bars for the moments that looked most like right now - and asks what the market did after each of those moments. The result is a live probability for each regime, not a hard categorical label.
The output is three things simultaneously:
- a background color telling you the dominant regime
- a dashboard showing live probability bars for all three states
- change markers appearing only when the classifier is genuinely confident a shift has occurred.
█ THE FOUR REGIMES
🔵 TRENDING — price is moving directionally with efficiency. Momentum strategies belong here. Mean reversion strategies get punished here.
🟣 RANGING — price is oscillating between levels with no net directional movement. Mean reversion strategies and fade-the-extreme setups have edge here. Trend-following generates whipsaws.
🟡 VOLATILE TREND — price is trending and ATR has expanded sharply beyond its baseline. This captures earnings gaps, macro shocks, and post-breakout expansion. It is a distinct fourth state — not simply "a strong trend." Reduce size or trail very tightly.
⬛ UNCERTAIN — the dominant probability did not clear the minimum confidence threshold. The market's character is genuinely ambiguous. The best action is observation, not engagement.
█ HOW IT WORKS — THE FULL PIPELINE
Step 1 — Six features, measured every bar
Each bar is described by six measurements, each capturing a different dimension of market character:
• ADX — trend strength. Not direction — only how strongly price is committed to any direction.
• ATR ratio — current ATR divided by its own long-term average. Measures whether volatility is elevated or compressed relative to its own history.
• Choppiness Index — measures how much of the price movement was wasted going sideways. Near 100 = pure chop. Near 38 = perfectly directional.
• Bollinger Band width — how expanded or compressed the bands are relative to price. A compression often precedes volatile expansion.
• Normalized slope — linear regression slope over N bars, divided by ATR. A scale-free measure of directional momentum.
• Kaufman Efficiency Ratio — how directly did price move from A to B? If price traveled 100 points total but only net-moved 20, ER is 0.20. High ER = trending cleanly. Low ER = zigzagging.
Step 2 — Z-score normalization
ADX runs 0–100. ATR ratio runs 0.5–3.0. BB width might be 0.01–0.08 on forex. Using raw values in a distance calculation means the largest-scale feature dominates by sheer magnitude. All six features are standardized: z = (value − rolling mean) / rolling stdev. This puts every feature on equal footing — a reading of +2.0 means "two standard deviations above normal" on any feature. Critically, the mean and stdev are computed on prior bars only (src[1] offset), which eliminates look-ahead bias from the normalization step.
Step 3 — Labeling historical bars
For every historical bar, the script evaluates what happened over the following Forward Bars window:
• If the net price move exceeded Trend Threshold × average ATR over the window → labeled TRENDING (1)
• If the ATR ratio exceeded Volatility Threshold → labeled VOLATILE TREND (3)
• If trending AND volatile simultaneously → labeled VOLATILE TREND (3), because risk context takes priority
• Otherwise → labeled RANGING (2)
This label is only ever read at an offset of at least Forward Bars bars into the past, so the current bar carries no label — there is no look-ahead in the training data.
Step 4 — KNN search and Gaussian-weighted voting
On each bar, the algorithm scans the historical window (default 700 bars) and computes the Minkowski distance between today's six Z-scored features and every historical bar's six features. The K nearest matches are selected. Closer neighbors receive exponentially higher voting weight via a Gaussian kernel: w = exp(−d² / 2σ²). This means a bar at distance 0.1 vastly outweighs one at distance 0.5. The votes produce three probabilities — P(trending), P(ranging), P(volatile trend) — that always sum to 1.
Step 5 — Three-stage noise filtering
A single KNN output can flicker bar to bar. Three filters eliminate this:
• Mode filter — selects the most common regime over the last smooth_len bars. Removes 1-3 bar flickers entirely.
• Confirmation filter — the smoothed regime must hold steady for confirm_bars consecutive bars before being accepted. Kills false starts.
• Signal gap — regime change markers only appear once per signal_gap bars minimum, and only when the dominant probability exceeds 65%. This eliminates cluttered charts entirely.
█ DESIGN DECISIONS — WHAT WAS INITIALLY, WHAT CHANGED AND WHY
From 3 regimes to 4
The first idea used three regimes with a simple override: if volatility was high, VOLATILE replaced TRENDING regardless of whether price was actually moving directionally. Testing on stocks showed this caused problems — an earnings-day spike during a clear uptrend was collapsing the trend signal entirely. We realized volatile trending markets are qualitatively different from volatile ranging markets. A fast trend during an OPEC announcement is not the same as a gap-down in a sideways consolidation. VOLATILE TREND became its own regime, and the distinction turned out to be the most practically useful change in the entire script.
From stride = fwd_bars to stride = 3
The early idea for the script we had sampled the training window with a stride equal to Forward Bars (30 by default). This gave roughly 23 training samples — barely enough for KNN to make a meaningful comparison. Reducing the stride to 3 gives approximately 230 samples. The regime classification became dramatically more stable and consistent, especially in quieter markets where the 23-sample version frequently returned UNCERTAIN. The trade-off is slightly more computation, which Pine handles comfortably within its limits.
From a single volatile threshold to a combined trend + volatile check
Originally we labeled VOLATILE based purely on ATR ratio exceeding a threshold. This correctly flagged high-volatility periods but was labeling slow low-ATR trends as RANGING instead of TRENDING during prolonged low-volatility bull markets. The label logic was reworked to check directionality and volatility independently and then combine them: a trending move is TRENDING unless ATR is also elevated, in which case it becomes VOLATILE TREND. This made the label logic honest about what the market was actually doing.
The Efficiency Ratio addition
The original five features (ADX, ATR ratio, Choppiness, BB width, Slope) left a gap: two markets can have identical ADX and slope but very different directional efficiency — one moves in a clean staircase, the other zigzags the same distance. Kaufman's Efficiency Ratio fills this gap. ER = 0.85 on a bar means 85% of all price movement went in the net direction. ER = 0.20 means price was thrashing around and barely net-moved. It proved particularly valuable for distinguishing true trending from noisy ranging in crypto and high-beta stocks.
The regime change marker clutter problem
Early testing produced charts covered in triangles, circles, and diamonds — a new marker on almost every regime flicker. Three parameters were added to solve this: the mode filter, the confirmation bars requirement, and the signal gap. Together they ensure a marker only appears when (a) the majority of recent bars agree on the new regime, (b) it has held for at least N bars, and (c) the KNN confidence is above 65%. The result is 2–6 meaningful markers per year on a daily chart rather than dozens of noisy ones.
█ WHAT YOU SEE ON THE CHART
- Background color — the dominant confirmed regime, colored continuously. Cyan = Trending. Magenta = Ranging. Amber = Volatile Trend. No color = Uncertain.
- Bar coloring — individual bars colored by the same regime. Toggle off if you prefer your own candle coloring scheme.
- Regime change markers — small shapes at confirmed, high-confidence regime transitions only. ▲ below bar = shift to Trending. ● below bar = shift to Ranging. ◆ above bar = shift to Volatile Trend.
- Dashboard (top right) — shows the confirmed regime label, confidence percentage, three probability meters (▰▰▰▱▱▱ format), and six live feature readings. The bottom row shows Raw → Smooth (e.g. "T → R") so you can see what the raw KNN output is before the filters process it — useful for understanding when the classifier is about to change state.
█ SETTINGS REFERENCE
🧠 KNN Engine
• K Neighbors — how many historical bars vote. Lower = faster reaction, higher = more stable. Default 25.
• Lookback Window — how many bars to search for neighbors. Larger = more training data. Default 700.
• Minkowski p — distance exponent. 1 = Manhattan (robust to outliers), 2 = Euclidean (standard). Default 2.
• Gaussian bandwidth — how steeply neighbor weight falls with distance. Lower = only the closest neighbors matter. Default 1.5.
• Minimum confidence — probability threshold below which the regime shows as UNCERTAIN. Default 0.45.
🏷️ Labeling
• Forward bars — how many bars ahead define a historical bar's regime label. Match your typical hold time. Default 30.
• Trend threshold — net move must exceed this × avg ATR to label TRENDING. Lower = more bars labeled trending. Default 1.2.
• Volatility threshold — ATR ratio must exceed this to label VOLATILE TREND. Higher = only extreme events qualify. Default 1.5.
📐 Features
• ADX Length — period for the directional movement index. Longer = smoother. Default 20.
• ATR Length — period for average true range. Default 14.
• ATR Baseline — SMA period for the ATR ratio denominator. Longer = more stable baseline. Default 100.
• Choppiness / BB / Slope lengths — feature calculation periods. All default to 20–30.
• Efficiency Ratio Length — Kaufman ER lookback. Default 30.
🧹 Filtering
• Regime Smoothing Lookback — mode filter window. Higher = fewer false regime changes. Default 11.
• Bars to confirm regime — consecutive bars required before a new regime is accepted. Default 4.
• Min bars between signals — minimum spacing between regime change markers. Default 20.
█ SETTINGS BY ASSET CLASS
📈 Large-cap stocks — daily (AMZN, AAPL, NVDA)
Stocks trend slowly over weeks to months, with sharp one-day volatility spikes on earnings. All feature lengths should be longer to resolve the slower regime pace.
• Forward bars: 20–30 | Trend threshold: 0.8–1.2 | Volatility threshold: 2.0–2.5
• ATR Baseline: 100 | ADX / Chop / Slope lengths: 20 | BB length: 30 | EffR: 30
• Smoothing: 11 | Confirm bars: 4–5 | Signal gap: 20
• Note: use 0.8 trend threshold for slow defensive stocks (JNJ, KO), 1.2 for high-beta tech (NVDA, TSLA)
₿ Crypto — daily (BTC, ETH, large caps)
Crypto regimes flip in days, not months. ATR is 3–7× higher than stocks. Shorter windows, lower thresholds, less smoothing.
• Forward bars: 10–14 | Trend threshold: 1.5–2.5 | Volatility threshold: 1.5–2.0
• ATR Baseline: 50–70 | All feature lengths: 14 | EffR: 14–20
• Smoothing: 5–7 | Confirm bars: 2–3 | Signal gap: 7–10
• Note: for altcoins use trend threshold 2.0–2.5; for BTC use 1.5–2.0
💱 Forex — daily (EUR/USD, GBP/USD, USD/JPY)
Forex trends are driven by central bank divergence and last months. Daily ATR is tiny (0.4–0.7% of price). Everything needs to be longer and slower.
• Forward bars: 30–45 | Trend threshold: 0.6–0.8 | Volatility threshold: 2.5–3.0
• ATR Baseline: 120–150 | ADX length: 20–25 | Slope / EffR: 40–50
• Smoothing: 15–21 | Confirm bars: 5–7 | Signal gap: 30–45
• Note: exotic pairs (USD/TRY, USD/ZAR) behave like crypto — use crypto settings instead
🛢️ Commodities — daily (Gold XAU, Oil WTI)
Gold is slow and stable like equities. Oil is fast and event-driven like crypto. Use different profiles.
• Gold: Forward bars 20, Trend 0.8, Vol 2.5, ATR Base 100, Smooth 11, Confirm 4, Gap 20
• Oil: Forward bars 15, Trend 1.2, Vol 2.0, ATR Base 70, Smooth 7, Confirm 2–3, Gap 10
• Note: OPEC events and geopolitical shocks will correctly fire VOLATILE TREND on oil — this is intended behavior
🌐 Indices — daily (SPX, NDX, DAX)
Indices are the most regime-stable asset class. They trend 65–75% of the time and have the cleanest feature signals of any asset.
• Forward bars: 20–30 | Trend threshold: 0.8–1.0 | Volatility threshold: 2.0–2.5
• ATR Baseline: 120 | ADX length: 20 | Smoothing: 11–15 | Confirm bars: 4–5 | Signal gap: 20–30
• Note: NDX is ~30% more volatile than SPX — use trend threshold 1.0 for NDX, 0.8 for SPX
EXAMPLE
█ HOW TO USE WITH OTHER INDICATORS
This script does not generate buy or sell signals. It tells you which type of strategy has edge right now. The intended workflow:
1 — Add your momentum or mean reversion indicator alongside this one.
2 — Only take momentum / trend-following entries when the background is cyan (TRENDING).
3 — Only take mean reversion / fade entries when the background is magenta (RANGING).
4 — Reduce position size or step aside entirely when the background is amber (VOLATILE TREND).
5 — Do nothing when there is no background color — the regime is UNCERTAIN.
Used this way, the classifier acts as a strategy mode selector rather than a signal generator. It is the foundation of a multi-strategy system where the same chart hosts different logic depending on detected conditions.
█ LIMITATIONS
• KNN is a lazy learner — it reflects patterns in its training window. If the current market regime has no historical analog in the lookback window (e.g. a once-in-a-decade crash), the classifier will misclassify or return UNCERTAIN.
• The script requires a warm-up period equal to Lookback Window + Forward Bars bars before producing output. On instruments with limited history this may delay the first valid reading.
• Computation scales with window size and stride. Very large windows (2000+) may slow chart rendering on lower-end machines.
• The reversion probability reflects historical frequency, not a guarantee of future behavior. All market regimes can and do fail.
Human vs Machine🧠vs 🤖
And most importantly, checking the chart with the HUMAN EYE is different from using the raw ML KNN method - something we agreed on checking the charts, as we, traders-developers, had different opinions of the market regime for an asset price. But the Script might yield results we can all agree upon.
█ DISCLAIMER
This indicator is a decision-support tool, not a trading system. It does not constitute financial advice. Past regime patterns do not guarantee future behavior. Always apply proper risk management.
Algorithm: K-Nearest Neighbors (KNN)
Distance metric: Minkowski Distance (p=2, Euclidean default)
Kernel: Gaussian (distance-weighted voting)
Normalization: Z-Score (look-ahead free)
Regimes: Trending | Ranging | Volatile Trend | Uncertain
Nota Keluaran
//Changed the default settings for trend and volatilitySkrip sumber terbuka
Dalam semangat TradingView sebenar, pencipta skrip ini telah menjadikannya sumber terbuka, jadi pedagang boleh menilai dan mengesahkan kefungsiannya. Terima kasih kepada penulis! Walaupuan anda boleh menggunakan secara percuma, ingat bahawa penerbitan semula kod ini tertakluk kepada Peraturan Dalaman.

Connect the dots to elevate your trading.
Penafian
Maklumat dan penerbitan adalah tidak bertujuan, dan tidak membentuk, nasihat atau cadangan kewangan, pelaburan, dagangan atau jenis lain yang diberikan atau disahkan oleh TradingView. Baca lebih dalam Terma Penggunaan.
Skrip sumber terbuka
Dalam semangat TradingView sebenar, pencipta skrip ini telah menjadikannya sumber terbuka, jadi pedagang boleh menilai dan mengesahkan kefungsiannya. Terima kasih kepada penulis! Walaupuan anda boleh menggunakan secara percuma, ingat bahawa penerbitan semula kod ini tertakluk kepada Peraturan Dalaman.
Connect the dots to elevate your trading.
Penafian
Maklumat dan penerbitan adalah tidak bertujuan, dan tidak membentuk, nasihat atau cadangan kewangan, pelaburan, dagangan atau jenis lain yang diberikan atau disahkan oleh TradingView. Baca lebih dalam Terma Penggunaan.