Valuation
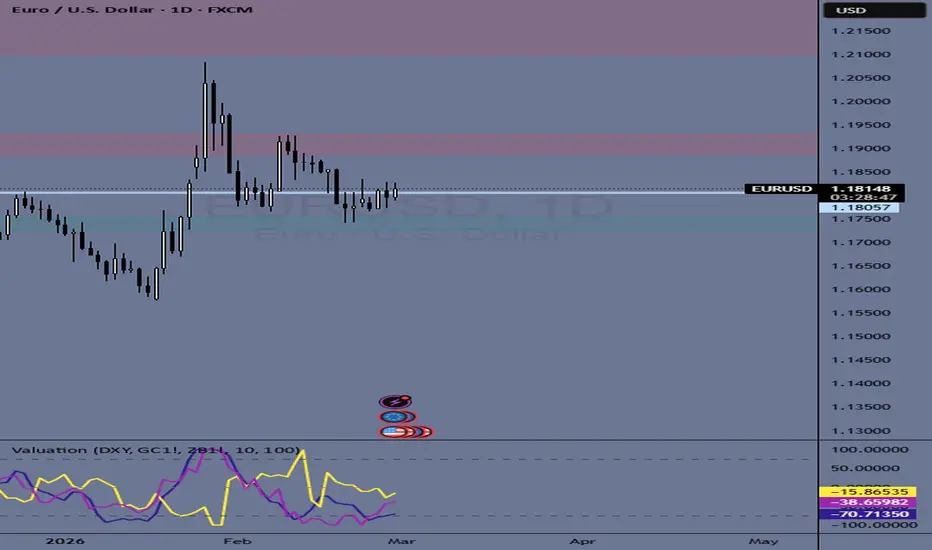
Valuation is a relative performance and mean-reversion indicator designed to measure how overvalued or undervalued the current chart symbol is compared to up to three benchmark assets.
By default, it compares price behavior against:
U.S. Dollar Index (DXY)
Gold Futures (GC1!)
U.S. Treasury Bond Futures (ZB1!)
All comparison symbols are fully customizable.
🔎 What It Does
The indicator:
Calculates the percentage change over a selected lookback period (default: 10 bars) for:
The current chart symbol
Three selected benchmark symbols
Computes the performance difference:
Relative Difference = Symbol % Change − Benchmark % Change
Rescales the difference over a longer rolling window (default: 100 bars) into a normalized range between:
-100 → +100
This normalization allows consistent interpretation across different assets and timeframes.
📊 How to Interpret
Above +75 → Potentially overvalued vs. benchmark
Below -75 → Potentially undervalued vs. benchmark
Near 0 → Fair relative value
Because it measures relative performance, this is not a traditional oscillator. It highlights divergence and excess movement compared to macro drivers or reference markets.
🧠 Practical Use Cases
Traders use this indicator to:
Detect stretched moves vs. macro assets
Identify mean-reversion opportunities
Spot cross-asset divergence
Confirm or fade momentum extremes
Evaluate whether price action is justified by external drivers
For example:
If EURUSD strongly outperforms DXY but DXY is stable, the pair may be overstretched.
If gold lags bonds during risk-off flows, it may signal temporary mispricing.
⚙️ Customization
Choose any three comparison symbols
Adjust percentage lookback length
Adjust rescaling window
Works on any timeframe
🎯 Core Idea
Markets rarely move in isolation.
This tool helps you determine whether price action is aligned with broader intermarket flows — or temporarily disconnected.
Used properly, it becomes a powerful relative value filter rather than just another oscillator.
By default, it compares price behavior against:
U.S. Dollar Index (DXY)
Gold Futures (GC1!)
U.S. Treasury Bond Futures (ZB1!)
All comparison symbols are fully customizable.
🔎 What It Does
The indicator:
Calculates the percentage change over a selected lookback period (default: 10 bars) for:
The current chart symbol
Three selected benchmark symbols
Computes the performance difference:
Relative Difference = Symbol % Change − Benchmark % Change
Rescales the difference over a longer rolling window (default: 100 bars) into a normalized range between:
-100 → +100
This normalization allows consistent interpretation across different assets and timeframes.
📊 How to Interpret
Above +75 → Potentially overvalued vs. benchmark
Below -75 → Potentially undervalued vs. benchmark
Near 0 → Fair relative value
Because it measures relative performance, this is not a traditional oscillator. It highlights divergence and excess movement compared to macro drivers or reference markets.
🧠 Practical Use Cases
Traders use this indicator to:
Detect stretched moves vs. macro assets
Identify mean-reversion opportunities
Spot cross-asset divergence
Confirm or fade momentum extremes
Evaluate whether price action is justified by external drivers
For example:
If EURUSD strongly outperforms DXY but DXY is stable, the pair may be overstretched.
If gold lags bonds during risk-off flows, it may signal temporary mispricing.
⚙️ Customization
Choose any three comparison symbols
Adjust percentage lookback length
Adjust rescaling window
Works on any timeframe
🎯 Core Idea
Markets rarely move in isolation.
This tool helps you determine whether price action is aligned with broader intermarket flows — or temporarily disconnected.
Used properly, it becomes a powerful relative value filter rather than just another oscillator.

Penafian
Maklumat dan penerbitan adalah tidak bertujuan, dan tidak membentuk, nasihat atau cadangan kewangan, pelaburan, dagangan atau jenis lain yang diberikan atau disahkan oleh TradingView. Baca lebih dalam Terma Penggunaan.
Penafian
Maklumat dan penerbitan adalah tidak bertujuan, dan tidak membentuk, nasihat atau cadangan kewangan, pelaburan, dagangan atau jenis lain yang diberikan atau disahkan oleh TradingView. Baca lebih dalam Terma Penggunaan.