Mark Minervini Trend Template VCP Breakout [Jayadev Rana]
WHAT IT IS
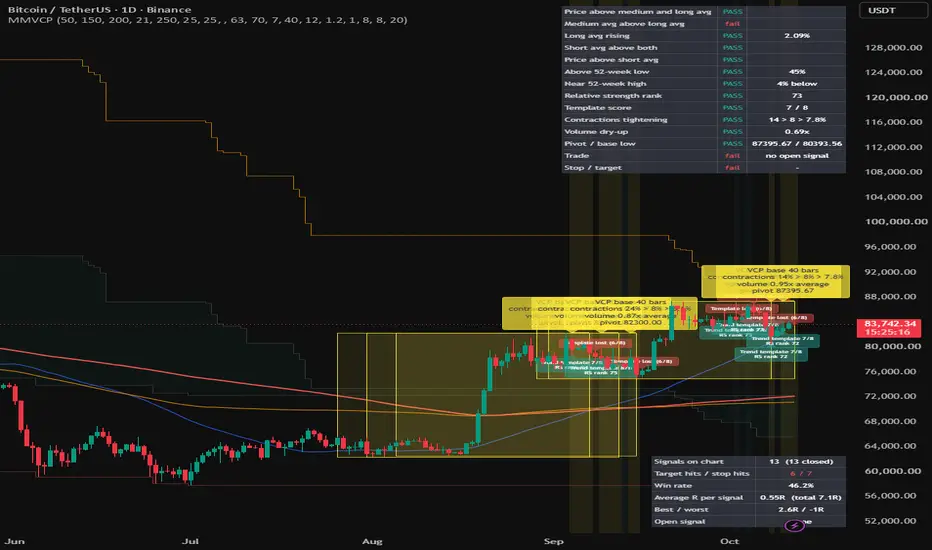
A long-side signal indicator that implements a classic stage-two momentum method: a strict trend template decides whether the symbol is in a healthy uptrend at all, a volatility-contraction base decides whether it is ready, and a volume-confirmed close through the base pivot prints the BUY. Every BUY is printed with its stop-loss and target, the levels are drawn as lines until the signal resolves, and each exit is labelled with its result in percent and R-multiples. A checklist table shows the eight template points live and a journal table keeps running statistics.
THE EIGHT-POINT TREND TEMPLATE
1. Price above the medium (150) and long (200) averages.
2. Medium average above the long average.
3. Long average rising over the last month (bars input).
4. Short (50) average above both longer averages.
5. Price above the short average.
6. Price at least X% above its 52-week low (default 25).
7. Price within X% of its 52-week high (default 25).
8. Relative strength rank at or above a threshold (default 70): the symbol's return over the lookback minus the benchmark's return, ranked against the last 52 weeks. The benchmark is chosen automatically by asset class or can be set.
The number of points required is an input (default seven of eight, so one weak point is tolerated; set eight for the strict version).
THE CONTRACTION BASE
Three nested windows (full base, half, quarter) are measured as high-low depth in percent. The base qualifies when each window is tighter than the one before it and the final contraction is below a maximum (default 12%), and when 5-bar volume is not above a ratio of 50-bar volume (default 1.2, i.e. volume is not expanding inside the base). The base is drawn as a box with a label giving the three contraction depths, the volume ratio and the pivot.
SIGNAL, STOP AND TARGET
BUY: a close above the base pivot (highest high of the base) that is not extended more than a few percent above it (default 8%), on volume at least the 50-bar average (multiplier input, default 1.0). Stop-loss: the base low, but never further than the maximum stop percentage (default 8%). Target: a fixed percentage above entry (default 20%). The signal is closed when the stop or target is touched, or on a close below the short average. Exits are labelled STOP, TARGET or EXIT with the percent result and R-multiple.
ON THE CHART
Three moving averages, the 52-week high and low, the shaded template price zone (between the minimum distance above the low and the maximum distance below the high), the contraction box, the pivot line, labels when the template is gained or lost, entry / stop / target lines from entry to exit with risk and reward fills, BUY and exit labels, and two tables: the live checklist and the signal journal (signals, target and stop hits, win rate, average R, best and worst R, open signal R).
INPUTS
Trend template lengths and thresholds, benchmark and relative strength lookback, base window and contraction limits, volume ratios, maximum extension, stop and target percentages, moving-average exit, display toggles.
ALERTS
BUY, target hit, stop hit, moving-average exit, base qualified.
INTENDED USE
Daily charts of stocks and ETFs are the natural home of this method; it also runs on crypto and index futures. Signals are infrequent by design because every point must line up.
LIMITATIONS
All conditions are evaluated on confirmed bars. The statistics in the journal are counted from the signals visible on the loaded history and are not a backtest with costs or sizing. Relative strength depends on the benchmark chosen. Past signals do not predict future ones. This is an educational tool, not financial advice.
A long-side signal indicator that implements a classic stage-two momentum method: a strict trend template decides whether the symbol is in a healthy uptrend at all, a volatility-contraction base decides whether it is ready, and a volume-confirmed close through the base pivot prints the BUY. Every BUY is printed with its stop-loss and target, the levels are drawn as lines until the signal resolves, and each exit is labelled with its result in percent and R-multiples. A checklist table shows the eight template points live and a journal table keeps running statistics.
THE EIGHT-POINT TREND TEMPLATE
1. Price above the medium (150) and long (200) averages.
2. Medium average above the long average.
3. Long average rising over the last month (bars input).
4. Short (50) average above both longer averages.
5. Price above the short average.
6. Price at least X% above its 52-week low (default 25).
7. Price within X% of its 52-week high (default 25).
8. Relative strength rank at or above a threshold (default 70): the symbol's return over the lookback minus the benchmark's return, ranked against the last 52 weeks. The benchmark is chosen automatically by asset class or can be set.
The number of points required is an input (default seven of eight, so one weak point is tolerated; set eight for the strict version).
THE CONTRACTION BASE
Three nested windows (full base, half, quarter) are measured as high-low depth in percent. The base qualifies when each window is tighter than the one before it and the final contraction is below a maximum (default 12%), and when 5-bar volume is not above a ratio of 50-bar volume (default 1.2, i.e. volume is not expanding inside the base). The base is drawn as a box with a label giving the three contraction depths, the volume ratio and the pivot.
SIGNAL, STOP AND TARGET
BUY: a close above the base pivot (highest high of the base) that is not extended more than a few percent above it (default 8%), on volume at least the 50-bar average (multiplier input, default 1.0). Stop-loss: the base low, but never further than the maximum stop percentage (default 8%). Target: a fixed percentage above entry (default 20%). The signal is closed when the stop or target is touched, or on a close below the short average. Exits are labelled STOP, TARGET or EXIT with the percent result and R-multiple.
ON THE CHART
Three moving averages, the 52-week high and low, the shaded template price zone (between the minimum distance above the low and the maximum distance below the high), the contraction box, the pivot line, labels when the template is gained or lost, entry / stop / target lines from entry to exit with risk and reward fills, BUY and exit labels, and two tables: the live checklist and the signal journal (signals, target and stop hits, win rate, average R, best and worst R, open signal R).
INPUTS
Trend template lengths and thresholds, benchmark and relative strength lookback, base window and contraction limits, volume ratios, maximum extension, stop and target percentages, moving-average exit, display toggles.
ALERTS
BUY, target hit, stop hit, moving-average exit, base qualified.
INTENDED USE
Daily charts of stocks and ETFs are the natural home of this method; it also runs on crypto and index futures. Signals are infrequent by design because every point must line up.
LIMITATIONS
All conditions are evaluated on confirmed bars. The statistics in the journal are counted from the signals visible on the loaded history and are not a backtest with costs or sizing. Relative strength depends on the benchmark chosen. Past signals do not predict future ones. This is an educational tool, not financial advice.

Penafian
Maklumat dan penerbitan adalah tidak bertujuan, dan tidak membentuk, nasihat atau cadangan kewangan, pelaburan, dagangan atau jenis lain yang diberikan atau disahkan oleh TradingView. Baca lebih dalam Terma Penggunaan.
Penafian
Maklumat dan penerbitan adalah tidak bertujuan, dan tidak membentuk, nasihat atau cadangan kewangan, pelaburan, dagangan atau jenis lain yang diberikan atau disahkan oleh TradingView. Baca lebih dalam Terma Penggunaan.