3-Candle Sweep [MaximoPartners]
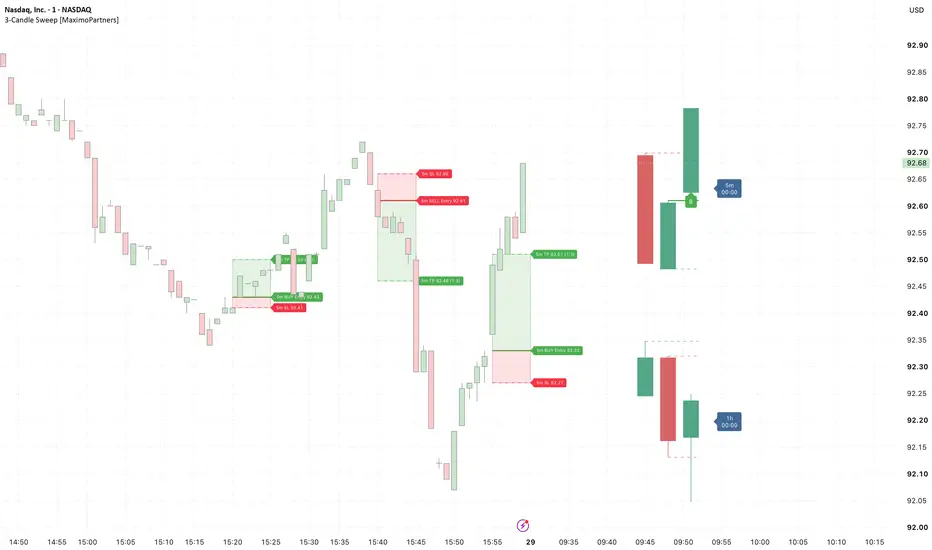
3-Candle Sweep displays candles from up to three selected timeframes alongside your chart and identifies a defined three-candle sweep pattern. It combines timeframe context, entry thresholds, and risk/reward drawings in one overlay.
How the setup works
The pattern uses three consecutive candles from each selected timeframe:
A candle that sweeps both the reference high and low is ignored. Exact touches do not qualify as sweeps or entry breaks.
Ready setups and B/S labels
Once the sweep candle closes, the indicator highlights the entry threshold with a green or red line. This setup is visible before the current candle crosses entry.
These labels update with the developing candle. They can disappear if price returns across the threshold; they are not permanent trade confirmations.
Entry, stop-loss and take-profit levels
On chart timeframes smaller than an enabled projection timeframe, the indicator can draw a setup zone at actual chart prices:
Entry and TP remain fixed when the ratio changes. A higher ratio reduces the initial stop distance. Stops are rounded to the instrument's tick size, so the actual ratio may differ slightly from the selected ratio.
If TP is not beyond entry in the intended direction, the indicator displays the entry threshold without a risk/reward zone. Setup zones span the entry candle.
Display and customization
How to use
Live behavior and limitations
Developing candles and signals change as prices update. Historical and replay detail depends on the chart timeframe and available data, particularly when viewing a projection timeframe smaller than the chart timeframe.
This is a visual analysis indicator. It does not place orders, backtest trades, or guarantee outcomes.
How the setup works
The pattern uses three consecutive candles from each selected timeframe:
- Reference candle: establishes the high and low.
- Sweep candle: moves beyond one side of the reference range, then closes strictly inside that range.
- Entry candle: the current candle, monitored for a break of the sweep candle's opposite extreme.
A candle that sweeps both the reference high and low is ignored. Exact touches do not qualify as sweeps or entry breaks.
- Bullish setup: the sweep candle trades below the reference low and closes back inside the reference range. Entry is at the sweep candle's high.
- Bearish setup: the sweep candle trades above the reference high and closes back inside the reference range. Entry is at the sweep candle's low.
Ready setups and B/S labels
Once the sweep candle closes, the indicator highlights the entry threshold with a green or red line. This setup is visible before the current candle crosses entry.
- A green B appears while the current price is above a valid bullish entry threshold.
- A red S appears while the current price is below a valid bearish entry threshold.
These labels update with the developing candle. They can disappear if price returns across the threshold; they are not permanent trade confirmations.
Entry, stop-loss and take-profit levels
On chart timeframes smaller than an enabled projection timeframe, the indicator can draw a setup zone at actual chart prices:
- Entry: sweep candle high for buys, or low for sells.
- TP: reference candle high for buys, or low for sells.
- SL: calculated from entry and TP using the selected 1:1, 1:3 or 1:5 risk-to-reward ratio.
Entry and TP remain fixed when the ratio changes. A higher ratio reduces the initial stop distance. Stops are rounded to the instrument's tick size, so the actual ratio may differ slightly from the selected ratio.
If TP is not beyond entry in the intended direction, the indicator displays the entry threshold without a risk/reward zone. Setup zones span the entry candle.
Display and customization
- Three independently selectable timeframes, each with a visibility toggle.
- Two to ten displayed candles per timeframe; default is three.
- Candle-close countdowns, updated as new chart data arrives.
- Optional B/S labels, ready setups and historical setups.
- Custom bullish and bearish candle colors.
- Adjustable position, overall size, candle height and spacing.
How to use
- Select and enable your analysis timeframes under "Timeframe Candles."
- To view their entry/SL/TP zones, use a smaller chart timeframe. For example, use a 1-minute chart with 5-minute and 15-minute analysis candles.
- Choose a risk-to-reward ratio under "Setup Levels."
- Enable historical setups if you want to review previously crossed entry thresholds.
- Customize colors and layout under "Appearance."
Live behavior and limitations
Developing candles and signals change as prices update. Historical and replay detail depends on the chart timeframe and available data, particularly when viewing a projection timeframe smaller than the chart timeframe.
This is a visual analysis indicator. It does not place orders, backtest trades, or guarantee outcomes.

Penafian
Maklumat dan penerbitan adalah tidak bertujuan, dan tidak membentuk, nasihat atau cadangan kewangan, pelaburan, dagangan atau jenis lain yang diberikan atau disahkan oleh TradingView. Baca lebih dalam Terma Penggunaan.
Penafian
Maklumat dan penerbitan adalah tidak bertujuan, dan tidak membentuk, nasihat atau cadangan kewangan, pelaburan, dagangan atau jenis lain yang diberikan atau disahkan oleh TradingView. Baca lebih dalam Terma Penggunaan.