OPEN-SOURCE SCRIPT
CBBI Rainbow Approximation (BTC Only)
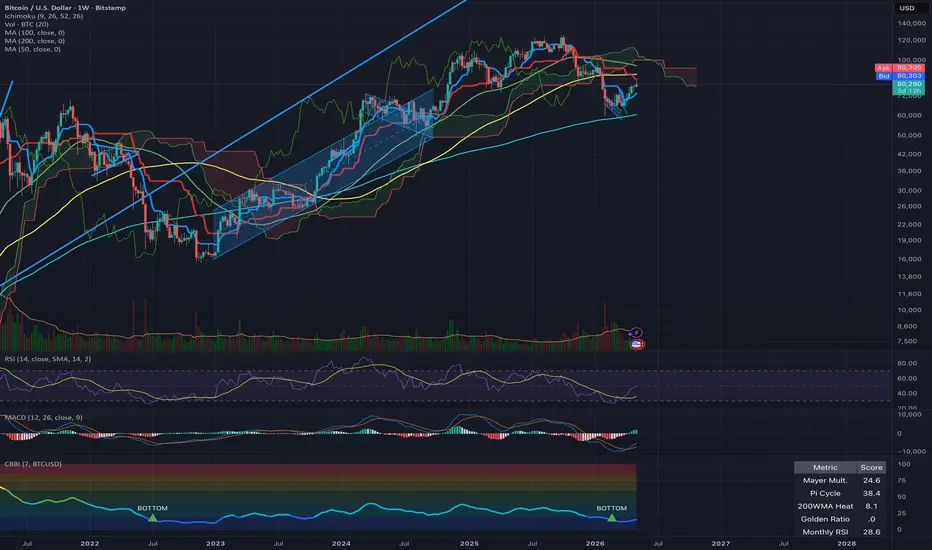
# CBBI Rainbow Approximation
## Overview
This indicator is a Pine Script **approximation inspired by the ColinTalksCrypto Bitcoin Bull Run Index (CBBI)** methodology. It is **not** the official CBBI and does not claim to reproduce its behavior — it follows the same general philosophy of combining multiple complementary valuation metrics into a single 0–100 confidence score, but uses a different set of inputs adapted to what is computable directly in Pine Script.
The original CBBI relies on 9 on-chain metrics (RHODL Ratio, Reserve Risk, Terminal Price, etc.) that are not available in Pine Script. This script substitutes those with 6 widely studied technical metrics and packages them into a single rainbow-colored oscillator for cycle context.
## Why a Composite Index Rather Than Individual Metrics
Each Bitcoin valuation metric has known weaknesses when used in isolation:
- The **Mayer Multiple** can stay elevated for months during strong bull runs without marking a top
- The **Pi Cycle Top** has fired only a handful of times historically — small sample size
- The **200-Week MA** is too slow to react during fast cycles
- The **Monthly RSI** is purely momentum-based with no valuation anchor
- The **Power Law** ignores cyclical behavior entirely
- The **Golden Ratio Multiplier** depends heavily on calibration
A composite score smooths out the individual weaknesses by requiring **broad agreement** across different methodological families before signaling a cycle extreme. A single metric flashing red is a weak signal; five or six aligning is a stronger one.
## Why These 6 Metrics Specifically
The metrics were chosen so that each one measures a **different dimension** of the market cycle, minimizing redundancy:
| Metric | Dimension Measured | Time Horizon |
|---|---|---|
| Mayer Multiple | Price extension above baseline | Medium term (200d) |
| Pi Cycle Top | Trend acceleration / MA convergence | Medium-long term |
| 200-Week MA Heatmap | Distance from multi-year support | Very long term |
| Golden Ratio Multiplier | Fibonacci-based cycle expansion | Long term |
| Monthly RSI | Pure momentum, no MA dependency | Macro |
| Power Law Regression | Log-log valuation anchor (no MA) | All-history |
Four of the six rely on moving averages of different lengths (111, 200, 350, 1400 days), but each one transforms that information in a structurally different way (ratio, crossover convergence, distance, multiplier band, regression). The remaining two (RSI, Power Law) intentionally bypass moving averages entirely to avoid over-weighting MA-based behavior.
## How the Score Is Built
1. Each metric is computed in **daily timeframe** (regardless of the chart's display timeframe)
2. Each metric is normalized to a **0–100 scale** based on its historical extremes
3. Available metrics are averaged into a raw composite score
4. The raw score is smoothed by a configurable SMA (default: 7 days)
When some metrics return NaN (e.g. the 200-week MA before mid-2014 because Bitcoin lacked the historical data), the script averages only the available ones. The "Metrics OK: X/6" cell in the info table shows how many metrics contributed to the current score.
## Rainbow Zones
The score is plotted against six color-coded zones derived from historical CBBI patterns:
- **0–20 (Blue)** — Capitulation: extreme value, historical accumulation zones
- **20–40 (Cyan)** — Accumulation: still undervalued
- **40–60 (Green)** — Neutral: fair value range
- **60–75 (Yellow)** — Bullish: trending toward overheated
- **75–85 (Orange)** — Overheated: caution advised
- **85–100 (Red)** — Blow-off Top: historical sell zones
Triangle markers print automatically when the score crosses 85 upward (probable top) or 15 downward (probable bottom).
## Multi-Timeframe Behavior
A common issue with Bitcoin cycle indicators is that switching from daily to weekly or monthly view distorts moving-average-based metrics. To prevent this, **all six metrics are computed in daily resolution via a single grouped `request.security` call**, regardless of the timeframe shown on the chart. The score therefore stays consistent whether you view it on the 1D, 1W, 1M, or higher timeframes — the line you see is always the daily score.
## Key Features
- 6 normalized metrics combined into a 0–100 composite score
- Multi-timeframe consistent (calculations forced to daily)
- Safe NaN handling for early Bitcoin history
- Live metrics table showing each component's contribution
- Built-in alerts for top (>85) and bottom (<15) crossovers
- Toggleable rainbow bands, score line, signals, and table
## How to Use
1. Apply the indicator to a Bitcoin chart (default symbol: `INDEX:BTCUSD`)
2. View on any timeframe — the score is computed in daily and remains consistent
3. The score entering the red zone (>85) historically aligns with cycle peaks
4. The score entering the blue zone (<20) historically aligns with cycle bottoms
5. Use as macro cycle context, not as a short-term timing tool
## Important Notes
- **This is not the official CBBI.** It is an open-source approximation. The official CBBI is maintained at colintalkscrypto.com and uses proprietary on-chain data feeds not accessible from Pine Script.
- **Past patterns may not repeat.** The thresholds and metric calibrations are based on Bitcoin's prior cycles. Future cycle behavior may differ as the market matures.
- **This is not financial advice.** The indicator provides cycle context only. Always combine multiple tools and conduct your own research before making investment decisions.
- **Not suitable for short-term trading.** The metrics are macro by design and update slowly.
## Credits
Conceptual inspiration from **Colin Talks Crypto** for the original CBBI methodology of combining multiple valuation metrics into a composite confidence score. Individual metrics (Mayer Multiple, Pi Cycle Top, 200-Week MA Heatmap, Golden Ratio Multiplier) are well-known public-domain Bitcoin cycle tools, none of which are reproduced from any specific TradingView script.
Skrip sumber terbuka
Dalam semangat TradingView sebenar, pencipta skrip ini telah menjadikannya sumber terbuka, jadi pedagang boleh menilai dan mengesahkan kefungsiannya. Terima kasih kepada penulis! Walaupuan anda boleh menggunakan secara percuma, ingat bahawa penerbitan semula kod ini tertakluk kepada Peraturan Dalaman.

Penafian
Maklumat dan penerbitan adalah tidak bertujuan, dan tidak membentuk, nasihat atau cadangan kewangan, pelaburan, dagangan atau jenis lain yang diberikan atau disahkan oleh TradingView. Baca lebih dalam Terma Penggunaan.
Skrip sumber terbuka
Dalam semangat TradingView sebenar, pencipta skrip ini telah menjadikannya sumber terbuka, jadi pedagang boleh menilai dan mengesahkan kefungsiannya. Terima kasih kepada penulis! Walaupuan anda boleh menggunakan secara percuma, ingat bahawa penerbitan semula kod ini tertakluk kepada Peraturan Dalaman.
Penafian
Maklumat dan penerbitan adalah tidak bertujuan, dan tidak membentuk, nasihat atau cadangan kewangan, pelaburan, dagangan atau jenis lain yang diberikan atau disahkan oleh TradingView. Baca lebih dalam Terma Penggunaan.