Trend Quality Band [EXCAVO]
More exclusive indicators from EXCAVO
Subscribe to EXCAVO PRO: Indicators + My Positions for $49.00/month to get exclusive indicators by this author. You pay right on TradingView and can use them on your charts straight away.
Explore EXCAVO PRO: Indicators + My PositionsVolatility-Ranked SuperTrend That Tightens in Calm Markets and Widens in Volatile Ones
The Trend Quality Band is an adaptive trend-following indicator built on a
SuperTrend core whose band width is controlled entirely by ATR percentile rank. Instead
of a fixed multiplier, the band compresses when current volatility is historically
low and expands when it is historically high - giving the trend line room when it
needs it and keeping it tight when conditions allow.
This is not a standard SuperTrend with a different parameter. The driving mechanism
is a statistical rank: each bar, the current ATR is compared against its full
lookback history to produce a 0-100% rank, which then scales the band multiplier
non-linearly between configurable compress and expand factors.
━━━━━━━━━━━━━━━━━━━━━━━━━━━━━━━━━━━━━━━
▸ HOW TO USE
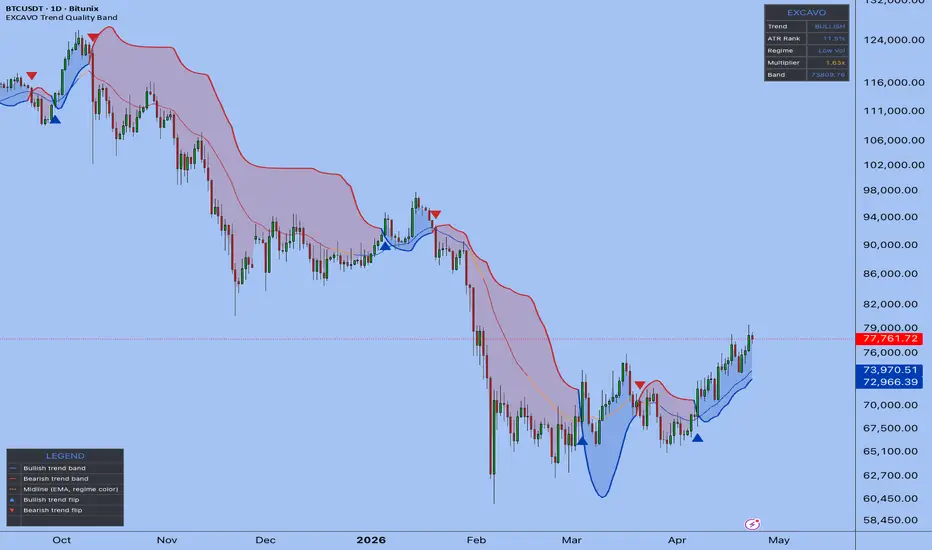
Step 1 → Add the indicator. The adaptive trend band appears immediately.
Blue band below price = bullish trend. Red band above price = bearish.
Step 2 → Watch for flip signals. Triangles mark the bar where the trend
changed direction. Bullish flip = triangle below bar. Bearish = above.
Step 3 → Read the ATR Rank in the dashboard. Below 35% = low volatility
(compressed band, trend holds tight). Above 65% = high volatility
(expanded band, wider room before a flip fires).
Step 4 → Use the Regime label. "Low Vol" means the band is near its
narrowest - trends confirmed here are high quality. "High Vol"
means the band is expanded to filter noise in choppy conditions.
Step 5 → Set alerts for Bullish or Bearish Trend Flip to be notified
on confirmed direction changes.
━━━━━━━━━━━━━━━━━━━━━━━━━━━━━━━━━━━━━━━
▸ HOW IT CALCULATES
◆ ATR Percentile Rank
On every bar, the indicator computes the ATR using the configured length, then
ranks it against its own history over the Rank Lookback period:
atr_rank = percentrank(ATR, lookback) / 100
This produces a value from 0 to 1. A rank of 0.1 means current ATR is lower
than 90% of recent history (unusually quiet). A rank of 0.9 means current ATR
exceeds 90% of recent history (unusually volatile).
◆ Non-Linear Multiplier Scaling
The rank is mapped to a scaling factor using three zones defined by the
Compress Below and Expand Above thresholds (default 0.35 / 0.65):
t = clamp((atr_rank - compress_thresh) / (expand_thresh - compress_thresh), 0, 1)
rank_scale = compress_factor + t x (expand_factor - compress_factor)
eff_mult = base_multiplier x rank_scale
When rank is below the compress threshold, rank_scale approaches the Compress
Factor (default 0.65). When rank exceeds the expand threshold, rank_scale
approaches the Expand Factor (default 1.55). Between the thresholds, the scale
interpolates linearly. The result: a multiplier that ranges from approximately
1.6x (base 2.5 x 0.65) to 3.9x (base 2.5 x 1.55) depending on regime.
◆ SuperTrend Ratchet Logic
The adaptive multiplier feeds a standard SuperTrend ratchet:
upper_raw = src + eff_mult x ATR
lower_raw = src - eff_mult x ATR
lower_band = close[1] > lower_band[1] ? max(lower_raw, lower_band[1]) : lower_raw
upper_band = close[1] < upper_band[1] ? min(upper_raw, upper_band[1]) : upper_raw
The ratchet means the active band can only move in the direction of the trend -
it never widens to catch a missed flip. A flip fires when price closes beyond
the active band. The direction variable tracks the current trend state.
◆ Regime Classification
The rank is compared against the two thresholds to produce a named regime:
Low Vol (rank < 0.35), Normal (0.35-0.65), or High Vol (rank > 0.65). This
regime label and the live multiplier value are shown in the dashboard so the
trader can see exactly why the band is positioned where it is.
━━━━━━━━━━━━━━━━━━━━━━━━━━━━━━━━━━━━━━━
▸ WHAT MAKES IT DIFFERENT
◆ ATR Percentile Rank as the Sole Driver
Most adaptive SuperTrend variants modulate bands using the Efficiency Ratio (a
directional momentum measure) or volatility ratios against a moving average.
This indicator uses a statistical rank: the current ATR is compared against its
entire recent history rather than a smoothed baseline. A rank of 80% means the
current bar is more volatile than 80% of recent bars - a precise, context-aware
signal that a fixed multiplier or a ratio cannot capture.
◆ Compress-and-Expand Band Behavior
The two-threshold system creates three distinct regimes. In the Low Vol regime
the band compresses toward the Compress Factor - trend flips require less
movement, keeping the indicator responsive during quiet trends. In the High Vol
regime the band expands toward the Expand Factor - preventing false flips during
breakouts and spike-heavy conditions. The Normal regime interpolates between
the two, creating a smooth transition rather than a step function.
◆ Live Multiplier Transparency
The dashboard shows the actual effective multiplier value on every bar. This
tells the trader exactly how wide the band currently is and why. When the
multiplier reads 1.6x the band is near its tightest. When it reads 3.8x the
band is near its widest. No guesswork about how the indicator is behaving.
◆ Non-Repainting by Default
Flip signals are gated by barstate.isconfirmed - they only fire on the closed
bar. The Allow Repainting input is available for users who prefer real-time
updates, but the default ensures historical flips on the chart are accurate.
━━━━━━━━━━━━━━━━━━━━━━━━━━━━━━━━━━━━━━━
▸ DASHBOARD
Real-time panel (top right by default) shows the current state:
Legend table (bottom left) identifies all visual elements on the chart:
━━━━━━━━━━━━━━━━━━━━━━━━━━━━━━━━━━━━━━━
▸ SETTINGS
Core Settings
ATR Rank Settings
Visualization
Dashboard
Alert Settings
━━━━━━━━━━━━━━━━━━━━━━━━━━━━━━━━━━━━━━━
▸ ALERTS
JSON payloads include action, direction, ticker, price, timeframe, and indicator.
━━━━━━━━━━━━━━━━━━━━━━━━━━━━━━━━━━━━━━━
Best regards,
EXCAVO
The Trend Quality Band is an adaptive trend-following indicator built on a
SuperTrend core whose band width is controlled entirely by ATR percentile rank. Instead
of a fixed multiplier, the band compresses when current volatility is historically
low and expands when it is historically high - giving the trend line room when it
needs it and keeping it tight when conditions allow.
This is not a standard SuperTrend with a different parameter. The driving mechanism
is a statistical rank: each bar, the current ATR is compared against its full
lookback history to produce a 0-100% rank, which then scales the band multiplier
non-linearly between configurable compress and expand factors.
━━━━━━━━━━━━━━━━━━━━━━━━━━━━━━━━━━━━━━━
▸ HOW TO USE
Step 1 → Add the indicator. The adaptive trend band appears immediately.
Blue band below price = bullish trend. Red band above price = bearish.
Step 2 → Watch for flip signals. Triangles mark the bar where the trend
changed direction. Bullish flip = triangle below bar. Bearish = above.
Step 3 → Read the ATR Rank in the dashboard. Below 35% = low volatility
(compressed band, trend holds tight). Above 65% = high volatility
(expanded band, wider room before a flip fires).
Step 4 → Use the Regime label. "Low Vol" means the band is near its
narrowest - trends confirmed here are high quality. "High Vol"
means the band is expanded to filter noise in choppy conditions.
Step 5 → Set alerts for Bullish or Bearish Trend Flip to be notified
on confirmed direction changes.
━━━━━━━━━━━━━━━━━━━━━━━━━━━━━━━━━━━━━━━
▸ HOW IT CALCULATES
◆ ATR Percentile Rank
On every bar, the indicator computes the ATR using the configured length, then
ranks it against its own history over the Rank Lookback period:
atr_rank = percentrank(ATR, lookback) / 100
This produces a value from 0 to 1. A rank of 0.1 means current ATR is lower
than 90% of recent history (unusually quiet). A rank of 0.9 means current ATR
exceeds 90% of recent history (unusually volatile).
◆ Non-Linear Multiplier Scaling
The rank is mapped to a scaling factor using three zones defined by the
Compress Below and Expand Above thresholds (default 0.35 / 0.65):
t = clamp((atr_rank - compress_thresh) / (expand_thresh - compress_thresh), 0, 1)
rank_scale = compress_factor + t x (expand_factor - compress_factor)
eff_mult = base_multiplier x rank_scale
When rank is below the compress threshold, rank_scale approaches the Compress
Factor (default 0.65). When rank exceeds the expand threshold, rank_scale
approaches the Expand Factor (default 1.55). Between the thresholds, the scale
interpolates linearly. The result: a multiplier that ranges from approximately
1.6x (base 2.5 x 0.65) to 3.9x (base 2.5 x 1.55) depending on regime.
◆ SuperTrend Ratchet Logic
The adaptive multiplier feeds a standard SuperTrend ratchet:
upper_raw = src + eff_mult x ATR
lower_raw = src - eff_mult x ATR
lower_band = close[1] > lower_band[1] ? max(lower_raw, lower_band[1]) : lower_raw
upper_band = close[1] < upper_band[1] ? min(upper_raw, upper_band[1]) : upper_raw
The ratchet means the active band can only move in the direction of the trend -
it never widens to catch a missed flip. A flip fires when price closes beyond
the active band. The direction variable tracks the current trend state.
◆ Regime Classification
The rank is compared against the two thresholds to produce a named regime:
Low Vol (rank < 0.35), Normal (0.35-0.65), or High Vol (rank > 0.65). This
regime label and the live multiplier value are shown in the dashboard so the
trader can see exactly why the band is positioned where it is.
━━━━━━━━━━━━━━━━━━━━━━━━━━━━━━━━━━━━━━━
▸ WHAT MAKES IT DIFFERENT
◆ ATR Percentile Rank as the Sole Driver
Most adaptive SuperTrend variants modulate bands using the Efficiency Ratio (a
directional momentum measure) or volatility ratios against a moving average.
This indicator uses a statistical rank: the current ATR is compared against its
entire recent history rather than a smoothed baseline. A rank of 80% means the
current bar is more volatile than 80% of recent bars - a precise, context-aware
signal that a fixed multiplier or a ratio cannot capture.
◆ Compress-and-Expand Band Behavior
The two-threshold system creates three distinct regimes. In the Low Vol regime
the band compresses toward the Compress Factor - trend flips require less
movement, keeping the indicator responsive during quiet trends. In the High Vol
regime the band expands toward the Expand Factor - preventing false flips during
breakouts and spike-heavy conditions. The Normal regime interpolates between
the two, creating a smooth transition rather than a step function.
◆ Live Multiplier Transparency
The dashboard shows the actual effective multiplier value on every bar. This
tells the trader exactly how wide the band currently is and why. When the
multiplier reads 1.6x the band is near its tightest. When it reads 3.8x the
band is near its widest. No guesswork about how the indicator is behaving.
◆ Non-Repainting by Default
Flip signals are gated by barstate.isconfirmed - they only fire on the closed
bar. The Allow Repainting input is available for users who prefer real-time
updates, but the default ensures historical flips on the chart are accurate.
━━━━━━━━━━━━━━━━━━━━━━━━━━━━━━━━━━━━━━━
▸ DASHBOARD
Real-time panel (top right by default) shows the current state:
- Trend - BULLISH or BEARISH, colored by direction
- ATR Rank - current ATR percentile rank as a percentage (0-100%)
- Regime - Low Vol / Normal / High Vol based on rank thresholds
- Multiplier - effective band multiplier currently in use
- Band - current price level of the active trend band
Legend table (bottom left) identifies all visual elements on the chart:
- ━ (blue) - Bullish trend band
- ━ (red) - Bearish trend band
- ┅ (orange) - Midline EMA, color reflects volatility regime
- ▲ (blue) - Bullish trend flip
- ▼ (red) - Bearish trend flip
━━━━━━━━━━━━━━━━━━━━━━━━━━━━━━━━━━━━━━━
▸ SETTINGS
Core Settings
- ATR Length - 14 (lookback for ATR calculation)
- Base Multiplier - 2.5 (center-point multiplier at rank = 0.5)
- Source - 0 = HL2, 1 = Close, 2 = HLC3
ATR Rank Settings
- Rank Lookback - 200 bars (history used for percentile rank)
- Compress Below - 0.35 (rank threshold for low volatility regime)
- Expand Above - 0.65 (rank threshold for high volatility regime)
- Compress Factor - 0.65 (multiplier scale at minimum rank)
- Expand Factor - 1.55 (multiplier scale at maximum rank)
Visualization
- Bullish Color - blue (customizable)
- Bearish Color - red (customizable)
- Signal Color - orange (customizable)
- Show Band Fill - ON (semi-transparent fill between band and price)
- Show Flip Signals - ON (arrow shapes at trend flip bars)
- Show Background - OFF (chart background colored by trend)
- Show Smooth Band - ON (EMA-smoothed band line, removes staircase appearance)
- Smooth Length - 5 (EMA period for band smoothing)
- Show Midline - ON (EMA of price colored by volatility regime)
- Midline Length - 20 (EMA period for the midline)
Dashboard
- Show Dashboard - ON
- Show Legend - ON
- Dashboard Position - Top Right
Alert Settings
- Allow Repainting - OFF
- JSON Alerts - OFF
━━━━━━━━━━━━━━━━━━━━━━━━━━━━━━━━━━━━━━━
▸ ALERTS
- Bullish Trend Flip - trend changed from bearish to bullish on bar close
- Bearish Trend Flip - trend changed from bullish to bearish on bar close
- Trend Flip - any direction change
JSON payloads include action, direction, ticker, price, timeframe, and indicator.
━━━━━━━━━━━━━━━━━━━━━━━━━━━━━━━━━━━━━━━
Best regards,
EXCAVO
Disclaimer
Trading involves significant risk. This indicator is a technical analysis tool
and does not constitute financial advice, investment recommendations, or a
guarantee of future results. Past indicator behavior does not guarantee future
performance. Always use proper risk management and your own judgment.

EXCAVO PRO: 13 indicators + my market research and position updates.
Subscribe on TradingView:
tradingview.com/scripts/marketplace/EXCAVO/
My Telegram:
t.me/ceoexcavo
Trading Tournament pnl.world/auth?ref=90144806
Subscribe on TradingView:
tradingview.com/scripts/marketplace/EXCAVO/
My Telegram:
t.me/ceoexcavo
Trading Tournament pnl.world/auth?ref=90144806
Penafian
Maklumat dan penerbitan adalah tidak bertujuan, dan tidak membentuk, nasihat atau cadangan kewangan, pelaburan, dagangan atau jenis lain yang diberikan atau disahkan oleh TradingView. Baca lebih dalam Terma Penggunaan.
EXCAVO PRO: 13 indicators + my market research and position updates.
Subscribe on TradingView:
tradingview.com/scripts/marketplace/EXCAVO/
My Telegram:
t.me/ceoexcavo
Trading Tournament pnl.world/auth?ref=90144806
Subscribe on TradingView:
tradingview.com/scripts/marketplace/EXCAVO/
My Telegram:
t.me/ceoexcavo
Trading Tournament pnl.world/auth?ref=90144806
Penafian
Maklumat dan penerbitan adalah tidak bertujuan, dan tidak membentuk, nasihat atau cadangan kewangan, pelaburan, dagangan atau jenis lain yang diberikan atau disahkan oleh TradingView. Baca lebih dalam Terma Penggunaan.