Fair Value Gap Screener [ITA]
🟠 OVERVIEW
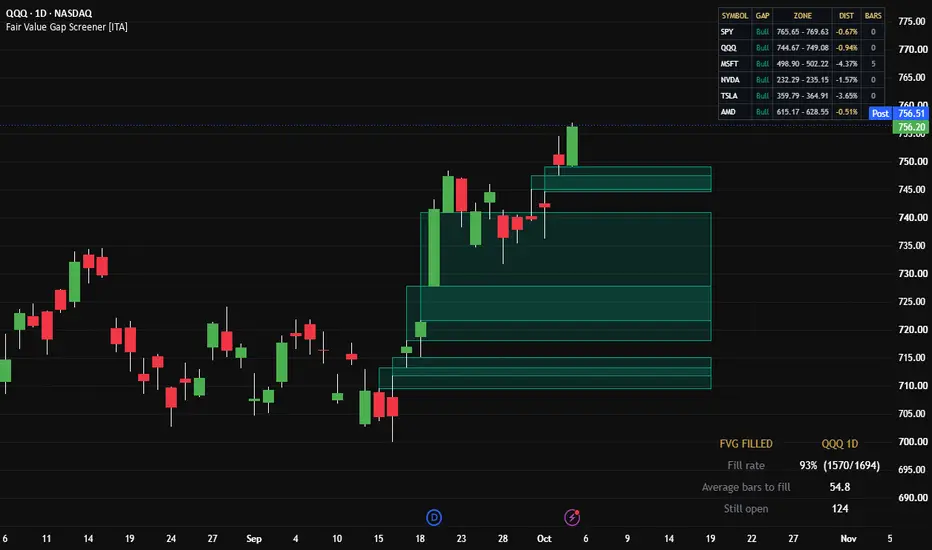
Fair Value Gap Screener marks imbalances on the chart, counts how many of them actually got filled, and at the same time watches up to ten other symbols for the same thing.
"Gaps always fill" is repeated everywhere as if it were a law. It is a claim, and it is measurable on the symbol in front of you. This counts it.
🟠 WHAT I MEASURED
QQQ daily: 93% of 1,694 gaps filled, taking 54.8 bars on average. 124 are still open.
The rate is not the interesting part. The wait is. A gap that fills two months after it formed is not a target you can hold a position against, and the average is published here so nobody has to take my word for it.
🟠 CONCEPTS
* Fair Value Gap - A three candle imbalance. The middle candle moves so hard that the wicks either side never overlap, leaving a range that traded in one direction only.
* Bar Gap - The plain gap between two neighbouring candles, which is what most people point at on a daily chart. It is a different zone from a fair value gap and it is selectable.
* Fill - Price trading back into the range. Either the first touch of the near edge, or a full pass all the way through.
* Still Open - A gap price has not come back to. It is not counted as a failure, it is simply not counted yet. Counting it would punish every recent gap for not having had time.
* Distance - How far price is from the near edge, as a percentage. This is the number that says whether a gap matters right now.
🟠 FEATURES
🔹 Fill rate, average bars to fill and open count, measured on the symbol and timeframe on screen
🔹 Ten configurable symbols scanned in parallel, with gap direction, the zone, distance and age
🔹 The distance figure turns gold when price is within one percent of the gap, so the symbol about to react stands out without reading the table
🔹 Three candle and two candle gaps, separately or together, because they are not the same zone
🔹 Zones stop extending after a set number of bars instead of crossing the whole chart as a stripe
🔹 Independent screener timeframe, so the daily can be scanned from an intraday chart
🟠 HOW TO USE
Set the ten symbols to whatever you actually trade. Read the DIST column first: a gap two percent away is context, a gold one is about to be tested.
Then read the fill rate at the bottom. If it is near one hundred percent, your Minimum Gap Size is too low and you are counting noise. A gap of a few cents fills almost immediately and tells you nothing.
The BARS column is how long a gap has been unfilled. Older gaps have had more chances to fill and did not, which is worth knowing before treating one as a target.
🟠 CONCLUSION
Gaps are easy to draw and easy to miss. The part worth knowing is not whether they fill, it is how long you would have had to wait.
Fair Value Gap Screener marks imbalances on the chart, counts how many of them actually got filled, and at the same time watches up to ten other symbols for the same thing.
"Gaps always fill" is repeated everywhere as if it were a law. It is a claim, and it is measurable on the symbol in front of you. This counts it.
🟠 WHAT I MEASURED
QQQ daily: 93% of 1,694 gaps filled, taking 54.8 bars on average. 124 are still open.
The rate is not the interesting part. The wait is. A gap that fills two months after it formed is not a target you can hold a position against, and the average is published here so nobody has to take my word for it.
🟠 CONCEPTS
* Fair Value Gap - A three candle imbalance. The middle candle moves so hard that the wicks either side never overlap, leaving a range that traded in one direction only.
* Bar Gap - The plain gap between two neighbouring candles, which is what most people point at on a daily chart. It is a different zone from a fair value gap and it is selectable.
* Fill - Price trading back into the range. Either the first touch of the near edge, or a full pass all the way through.
* Still Open - A gap price has not come back to. It is not counted as a failure, it is simply not counted yet. Counting it would punish every recent gap for not having had time.
* Distance - How far price is from the near edge, as a percentage. This is the number that says whether a gap matters right now.
🟠 FEATURES
🔹 Fill rate, average bars to fill and open count, measured on the symbol and timeframe on screen
🔹 Ten configurable symbols scanned in parallel, with gap direction, the zone, distance and age
🔹 The distance figure turns gold when price is within one percent of the gap, so the symbol about to react stands out without reading the table
🔹 Three candle and two candle gaps, separately or together, because they are not the same zone
🔹 Zones stop extending after a set number of bars instead of crossing the whole chart as a stripe
🔹 Independent screener timeframe, so the daily can be scanned from an intraday chart
🟠 HOW TO USE
Set the ten symbols to whatever you actually trade. Read the DIST column first: a gap two percent away is context, a gold one is about to be tested.
Then read the fill rate at the bottom. If it is near one hundred percent, your Minimum Gap Size is too low and you are counting noise. A gap of a few cents fills almost immediately and tells you nothing.
The BARS column is how long a gap has been unfilled. Older gaps have had more chances to fill and did not, which is worth knowing before treating one as a target.
🟠 CONCLUSION
Gaps are easy to draw and easy to miss. The part worth knowing is not whether they fill, it is how long you would have had to wait.

Pine Script developer & trader. I build clean indicators - Smart Money Concepts, scanners, risk tools. ITAtradingtools.com
Penafian
Maklumat dan penerbitan adalah tidak bertujuan, dan tidak membentuk, nasihat atau cadangan kewangan, pelaburan, dagangan atau jenis lain yang diberikan atau disahkan oleh TradingView. Baca lebih dalam Terma Penggunaan.
Pine Script developer & trader. I build clean indicators - Smart Money Concepts, scanners, risk tools. ITAtradingtools.com
Penafian
Maklumat dan penerbitan adalah tidak bertujuan, dan tidak membentuk, nasihat atau cadangan kewangan, pelaburan, dagangan atau jenis lain yang diberikan atau disahkan oleh TradingView. Baca lebih dalam Terma Penggunaan.