OPEN-SOURCE SCRIPT
Telah dikemas kini Average Price / Time
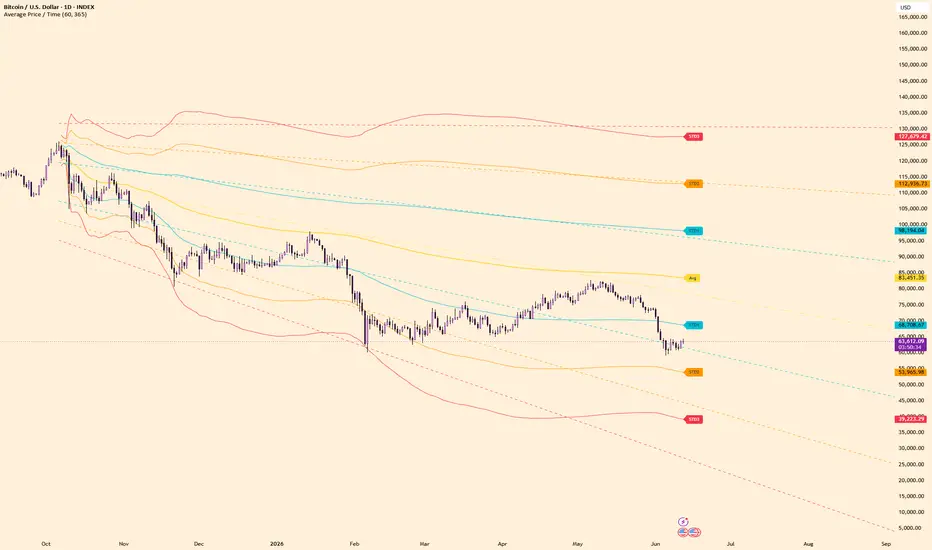
Average Price / Time calculates an anchored time-at-price average from a selected starting candle.
The script uses 1-hour candle ranges by default and treats time as evenly distributed across each candle’s high-low range. From the selected anchor point, it calculates the average price and plots standard deviation bands around it.
Features:
- Mouse-selected start candle
- Time-at-price average
- STD1, STD2, and STD3 bands
- Current z-score shown in the data window
Note:
This is a time-at-price approximation, not a volume-weighted calculation. It measures where price spent time, not where the most volume traded.
The script uses 1-hour candle ranges by default and treats time as evenly distributed across each candle’s high-low range. From the selected anchor point, it calculates the average price and plots standard deviation bands around it.
Features:
- Mouse-selected start candle
- Time-at-price average
- STD1, STD2, and STD3 bands
- Current z-score shown in the data window
Note:
This is a time-at-price approximation, not a volume-weighted calculation. It measures where price spent time, not where the most volume traded.
Nota Keluaran
Added linear-regression projection tools for Avg and standard deviation levels.The indicator now calculates regression slopes for Avg, STD1, STD2, and STD3 levels from the anchored period and draws forward projection lines based on those fitted trends.
Projection length is user configurable, and projected slopes are available in the data window.
Skrip sumber terbuka
Dalam semangat TradingView sebenar, pencipta skrip ini telah menjadikannya sumber terbuka, jadi pedagang boleh menilai dan mengesahkan kefungsiannya. Terima kasih kepada penulis! Walaupuan anda boleh menggunakan secara percuma, ingat bahawa penerbitan semula kod ini tertakluk kepada Peraturan Dalaman.

Penafian
Maklumat dan penerbitan adalah tidak bertujuan, dan tidak membentuk, nasihat atau cadangan kewangan, pelaburan, dagangan atau jenis lain yang diberikan atau disahkan oleh TradingView. Baca lebih dalam Terma Penggunaan.
Skrip sumber terbuka
Dalam semangat TradingView sebenar, pencipta skrip ini telah menjadikannya sumber terbuka, jadi pedagang boleh menilai dan mengesahkan kefungsiannya. Terima kasih kepada penulis! Walaupuan anda boleh menggunakan secara percuma, ingat bahawa penerbitan semula kod ini tertakluk kepada Peraturan Dalaman.
Penafian
Maklumat dan penerbitan adalah tidak bertujuan, dan tidak membentuk, nasihat atau cadangan kewangan, pelaburan, dagangan atau jenis lain yang diberikan atau disahkan oleh TradingView. Baca lebih dalam Terma Penggunaan.