OPEN-SOURCE SCRIPT
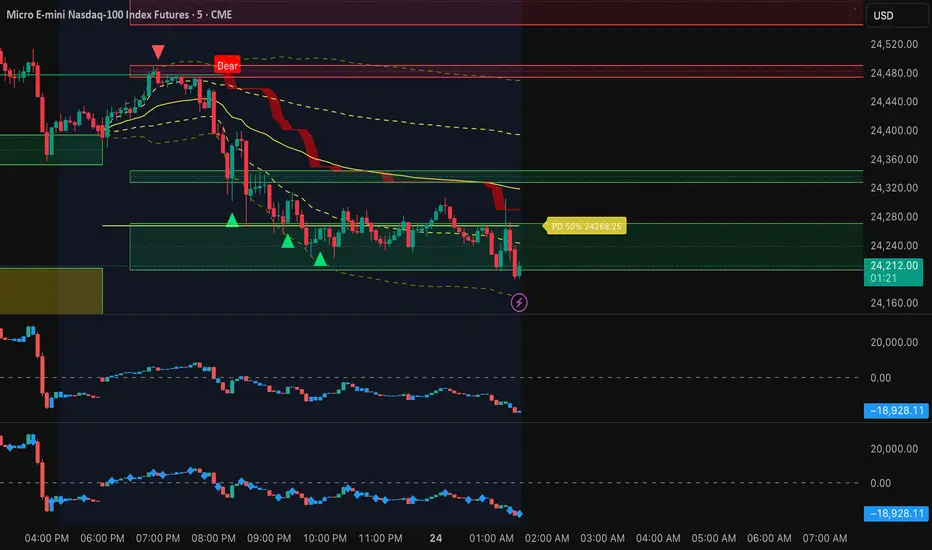
CVD Candles.
█ WHAT IS CVD?
Cumulative Volume Delta (CVD) tracks the running total of buying volume minus selling volume. It reveals who's in control — buyers or sellers — beyond what price alone shows.
█ HOW IT WORKS
Each candle represents the cumulative delta:
• Delta = Buy Volume − Sell Volume
• CVD = Running sum of delta
This creates a "price chart" of order flow, making it easy to spot divergences between price and actual buying/selling pressure.
█ 3-COLOR SYSTEM
🟢 GREEN — Strong Bullish
Price closed above previous bar's high. Buyers in control.
🔴 RED — Strong Bearish
Price closed below previous bar's low. Sellers in control.
🔵 BLUE — Neutral (Reversal Signal)
Price closed between previous high/low. Momentum pausing — watch for potential reversal.
█ HOW TO USE
1. TREND CONFIRMATION
Price up + CVD up (green) = Strong trend ✓
Price up + CVD down (red) = Weak trend, possible reversal
2. DIVERGENCE
Price making new highs but CVD declining = Bearish divergence
Price making new lows but CVD rising = Bullish divergence
3. REVERSAL SIGNALS
Blue candles indicate momentum pause — often precede reversals
█ SETTINGS
• Reset Daily: Resets CVD at each session start
• Works best on futures, stocks, and crypto with volume data
█ CREDITS
Inspired by Bookmap's Cumulative Delta indicator.
Cumulative Volume Delta (CVD) tracks the running total of buying volume minus selling volume. It reveals who's in control — buyers or sellers — beyond what price alone shows.
█ HOW IT WORKS
Each candle represents the cumulative delta:
• Delta = Buy Volume − Sell Volume
• CVD = Running sum of delta
This creates a "price chart" of order flow, making it easy to spot divergences between price and actual buying/selling pressure.
█ 3-COLOR SYSTEM
🟢 GREEN — Strong Bullish
Price closed above previous bar's high. Buyers in control.
🔴 RED — Strong Bearish
Price closed below previous bar's low. Sellers in control.
🔵 BLUE — Neutral (Reversal Signal)
Price closed between previous high/low. Momentum pausing — watch for potential reversal.
█ HOW TO USE
1. TREND CONFIRMATION
Price up + CVD up (green) = Strong trend ✓
Price up + CVD down (red) = Weak trend, possible reversal
2. DIVERGENCE
Price making new highs but CVD declining = Bearish divergence
Price making new lows but CVD rising = Bullish divergence
3. REVERSAL SIGNALS
Blue candles indicate momentum pause — often precede reversals
█ SETTINGS
• Reset Daily: Resets CVD at each session start
• Works best on futures, stocks, and crypto with volume data
█ CREDITS
Inspired by Bookmap's Cumulative Delta indicator.
Skrip sumber terbuka
Dalam semangat TradingView sebenar, pencipta skrip ini telah menjadikannya sumber terbuka, jadi pedagang boleh menilai dan mengesahkan kefungsiannya. Terima kasih kepada penulis! Walaupuan anda boleh menggunakan secara percuma, ingat bahawa penerbitan semula kod ini tertakluk kepada Peraturan Dalaman.

Penafian
Maklumat dan penerbitan adalah tidak bertujuan, dan tidak membentuk, nasihat atau cadangan kewangan, pelaburan, dagangan atau jenis lain yang diberikan atau disahkan oleh TradingView. Baca lebih dalam Terma Penggunaan.
Skrip sumber terbuka
Dalam semangat TradingView sebenar, pencipta skrip ini telah menjadikannya sumber terbuka, jadi pedagang boleh menilai dan mengesahkan kefungsiannya. Terima kasih kepada penulis! Walaupuan anda boleh menggunakan secara percuma, ingat bahawa penerbitan semula kod ini tertakluk kepada Peraturan Dalaman.
Penafian
Maklumat dan penerbitan adalah tidak bertujuan, dan tidak membentuk, nasihat atau cadangan kewangan, pelaburan, dagangan atau jenis lain yang diberikan atau disahkan oleh TradingView. Baca lebih dalam Terma Penggunaan.