OPEN-SOURCE SCRIPT
Telah dikemas kini Low-Lag Strength Oscillator
Low-Lag Strength Oscillator [LLSO]
What this script does
LLSO is a bounded 0–100 momentum oscillator in the relative-strength family. It measures the balance between up-strength and down-strength in price, but smooths each side with a low-lag two-pole low-pass filter instead of the rolling/exponential average a classic strength index uses. The result keeps the familiar overbought/oversold behaviour and the 50 balance line, but turns several bars earlier — better measurement of the same momentum, not a different concept bolted on.
Why these components are combined (mashup justification)
This is not several indicators shown side by side. There is exactly one plotted value — the smoothed strength oscillator. Everything else is a decision-support layer built on that single value, and each layer answers one specific question about the same oscillator:
The low-lag smoother is the core. A short EMA reduces lag but overshoots and adds noise; a long average is smooth but late. The two-pole low-pass filter removes lag in the pass band without the overshoot, so the up/down strength legs are both responsive and stable. This is what makes the oscillator usable for early reads.
Divergence compares price pivots to oscillator pivots. Because the oscillator is a strength reading, a higher price high against a lower oscillator high is fading strength — information that the line alone doesn't make explicit. Regular and hidden divergences are detected from confirmed pivots only.
Reversal dots mark the moment the line turns back from inside the overbought/oversold bands — a context cue about where in the range the turn happened, which a bare line forces you to eyeball.
The calibration harness is the reason the rest is trustworthy. It logs every signal the oscillator produces and, a fixed horizon later, checks whether price actually moved at least k×ATR in the signal's direction — then reports Hit %, the unconditional Base %, and the Edge (Hit − Base). It scores the oscillator's own output against reality.
These belong in one script because they all operate on, and report about, the same single oscillator. Splitting them into separate studies would mean re-deriving the oscillator three times and losing the shared pivot/threshold context that ties them together.
What makes it original
Two things. First, the strength index is rebuilt on a low-lag low-pass smoother rather than the conventional average, which changes its timing without changing its bounded, mean-reverting character. Second — and more importantly — most oscillators emit signals and never tell you whether those signals lead anywhere. LLSO carries a built-in honesty layer: the calibration harness shows the realized hit rate of its own signals against the base rate on your instrument and timeframe. If the Edge sits near zero, the script says so plainly. That measurement-first design, not the oscillator alone, is the contribution.
How to use it
Add to a chart. Defaults target intraday index futures (e.g. NSE NIFTY); for other instruments simply change the chart, or set the Price / High / Low source inputs (group 01) to retarget the engine — you can even feed it another indicator's plot.
Read the line: green above the 50 balance line = net up-strength, red below = net down-strength; the gradient fill and color saturation scale with conviction (distance from 50). The dashed bands mark overbought/oversold.
Use divergences as early warning of fading strength and reversal dots as in-band turn cues — points to investigate, not automatic trades.
Read the Edge row in the panel before trusting signals. A positive Edge means the signal preceded a forward move more often than chance on this symbol/timeframe; near zero means it didn't. The panel shows "warming" until enough samples accumulate.
The smoother period, OB/OS levels, divergence pivots, and the calibration horizon/threshold are all configurable.
Limitations
Statistics are in-sample, close-to-close, without costs — a study aid, not a backtest. They describe past behaviour on loaded history, not a forward guarantee.
Lower lag is better measurement, not an edge; an earlier turn is still wrong if the turn leads nowhere.
Divergence prints a few bars after the pivot it confirms — that lag is inherent to honest, non-repainting pivot detection.
This is an analytical oscillator. It issues no automated buy/sell instructions and is not a strategy.
Concept credit
The low-lag two-pole low-pass smoother and the strength-index reformulation are based on the published work of John F. Ehlers (Technical Analysis of Stocks & Commodities, 2024).
The Relative Strength Index that this oscillator generalizes is by J. Welles Wilder (New Concepts in Technical Trading Systems, 1978).
The implementation, the calibration harness, the divergence/reversal layers and the packaging are original.
Disclaimer
For research and educational purposes only. This script is not financial advice, not a recommendation, and not a guarantee of future results. Indicators describe price behaviour; they do not predict the future. Trading carries risk of loss. Test on out-of-sample data and make your own decisions. The author accepts no liability for any use of this script.
What this script does
LLSO is a bounded 0–100 momentum oscillator in the relative-strength family. It measures the balance between up-strength and down-strength in price, but smooths each side with a low-lag two-pole low-pass filter instead of the rolling/exponential average a classic strength index uses. The result keeps the familiar overbought/oversold behaviour and the 50 balance line, but turns several bars earlier — better measurement of the same momentum, not a different concept bolted on.
Why these components are combined (mashup justification)
This is not several indicators shown side by side. There is exactly one plotted value — the smoothed strength oscillator. Everything else is a decision-support layer built on that single value, and each layer answers one specific question about the same oscillator:
The low-lag smoother is the core. A short EMA reduces lag but overshoots and adds noise; a long average is smooth but late. The two-pole low-pass filter removes lag in the pass band without the overshoot, so the up/down strength legs are both responsive and stable. This is what makes the oscillator usable for early reads.
Divergence compares price pivots to oscillator pivots. Because the oscillator is a strength reading, a higher price high against a lower oscillator high is fading strength — information that the line alone doesn't make explicit. Regular and hidden divergences are detected from confirmed pivots only.
Reversal dots mark the moment the line turns back from inside the overbought/oversold bands — a context cue about where in the range the turn happened, which a bare line forces you to eyeball.
The calibration harness is the reason the rest is trustworthy. It logs every signal the oscillator produces and, a fixed horizon later, checks whether price actually moved at least k×ATR in the signal's direction — then reports Hit %, the unconditional Base %, and the Edge (Hit − Base). It scores the oscillator's own output against reality.
These belong in one script because they all operate on, and report about, the same single oscillator. Splitting them into separate studies would mean re-deriving the oscillator three times and losing the shared pivot/threshold context that ties them together.
What makes it original
Two things. First, the strength index is rebuilt on a low-lag low-pass smoother rather than the conventional average, which changes its timing without changing its bounded, mean-reverting character. Second — and more importantly — most oscillators emit signals and never tell you whether those signals lead anywhere. LLSO carries a built-in honesty layer: the calibration harness shows the realized hit rate of its own signals against the base rate on your instrument and timeframe. If the Edge sits near zero, the script says so plainly. That measurement-first design, not the oscillator alone, is the contribution.
How to use it
Add to a chart. Defaults target intraday index futures (e.g. NSE NIFTY); for other instruments simply change the chart, or set the Price / High / Low source inputs (group 01) to retarget the engine — you can even feed it another indicator's plot.
Read the line: green above the 50 balance line = net up-strength, red below = net down-strength; the gradient fill and color saturation scale with conviction (distance from 50). The dashed bands mark overbought/oversold.
Use divergences as early warning of fading strength and reversal dots as in-band turn cues — points to investigate, not automatic trades.
Read the Edge row in the panel before trusting signals. A positive Edge means the signal preceded a forward move more often than chance on this symbol/timeframe; near zero means it didn't. The panel shows "warming" until enough samples accumulate.
The smoother period, OB/OS levels, divergence pivots, and the calibration horizon/threshold are all configurable.
Limitations
Statistics are in-sample, close-to-close, without costs — a study aid, not a backtest. They describe past behaviour on loaded history, not a forward guarantee.
Lower lag is better measurement, not an edge; an earlier turn is still wrong if the turn leads nowhere.
Divergence prints a few bars after the pivot it confirms — that lag is inherent to honest, non-repainting pivot detection.
This is an analytical oscillator. It issues no automated buy/sell instructions and is not a strategy.
Concept credit
The low-lag two-pole low-pass smoother and the strength-index reformulation are based on the published work of John F. Ehlers (Technical Analysis of Stocks & Commodities, 2024).
The Relative Strength Index that this oscillator generalizes is by J. Welles Wilder (New Concepts in Technical Trading Systems, 1978).
The implementation, the calibration harness, the divergence/reversal layers and the packaging are original.
Disclaimer
For research and educational purposes only. This script is not financial advice, not a recommendation, and not a guarantee of future results. Indicators describe price behaviour; they do not predict the future. Trading carries risk of loss. Test on out-of-sample data and make your own decisions. The author accepts no liability for any use of this script.
Nota Keluaran
What's new in this versionThis update adds three research-backed refinements to the oscillator engine. Two are calibration-tested options you can A/B with the built-in Edge row; the third is a robustness fix that runs always. None of them changes the core idea — a low-lag strength oscillator with divergence, reversal context, and an honesty/calibration layer — they sharpen the measurement and let the extremes adapt to the instrument.
1 · Adaptive overbought/oversold bands (new — on by default)
The overbought/oversold lines can now float with the oscillator's own recent range instead of sitting at a fixed 70/30. Fixed levels assume the same extremes fit every symbol and every volatility regime, which they don't; floating levels keep the extremes calibrated to whatever you're actually trading. The overbought/oversold inputs now act as the position (in %) up the oscillator's recent range, with a lookback control for that range.
You can switch back to fixed levels with one toggle — and that's the point: the calibration harness scores whichever mode is active, so the Edge row tells you which your instrument prefers rather than you assuming. The background tint, reversal dots, divergence signals, and the dashboard "Zone" read all follow the live bands.
2 · Sharpen extremes — Inverse-Fisher mode (new — off by default)
An optional sigmoid compression that stretches the overbought/oversold zones and compresses the mid-range, so turns at the extremes become crisper and less ambiguous. It deliberately changes the oscillator's shape (the smooth strength line becomes a sharper toggle), which is why it's off by default. Turn it on, then re-check the Edge row to see whether the sharper triggers actually help on your market.
3 · Engine robustness (always on)
The strength ratio is now guarded against a near-zero denominator, and the normalized strength is bounded to its valid range before scaling. The low-lag smoother is built from a high-pass subtraction (it isn't a simple average), so on sharp transitions a smoothed strength leg could briefly overshoot; this fix removes that artifact without altering normal behaviour.
How to use the new options
Leave adaptive bands on for instrument-calibrated extremes, or toggle them off to compare against the classic fixed 70/30 — let the Edge row referee. Try the sharpening mode if you want decisive extreme turns and don't mind the squared-off shape. As always: read the Edge before trusting any signal. A refinement that doesn't move the Edge above the base rate isn't buying you predictability on that symbol/timeframe.
Honest note
These refinements improve measurement and adaptivity — where the extremes sit, how crisp the turns are — not directional edge. Adaptive bands make the thresholds appropriate to the instrument; the Inverse-Fisher mode sharpens when the same signal fires. Neither manufactures predictive content that isn't there, which is exactly why both are wired through the calibration harness so you can verify rather than assume. Statistics remain in-sample, close-to-close, without costs — a study aid, not a backtest.
Credits
Unchanged and given in full in the main description: the low-lag smoother and strength-index reformulation (John F. Ehlers), the Relative Strength Index it generalizes (J. Welles Wilder), and — new this version — the Inverse Fisher Transform behind the optional sharpening mode (John F. Ehlers, 2004). The adaptive bands use the established floating-levels approach.
Disclaimer
For research and educational purposes only. Not financial advice, not a recommendation, not a guarantee of future results. Trading carries risk of loss; test out-of-sample and make your own decisions.
Nota Keluaran
Low-Lag Strength Oscillator (short name: LLSO)New in this update — a randomness gate. An efficiency-ratio reading is added (how directional the path is versus how much it wandered to get there) with an adjustable threshold. When the tape is too whippy to be worth trading, the gate reads ✕ — a context cue that the oscillator's early turns are likely noise on this bar. The gate is exposed, not forced onto the signal, so you can A/B whether it improves the Edge.
New dashboard rows: Efficiency (ER), Edge floor.
New exports: EXP_Osc, EXP_Bias, EXP_ER, EXP_Efficient, EXP_Signal, EXP_Edge, EXP_EdgeLB, EXP_RunsZ.
Honest note: lower lag is better measurement, not an edge — an earlier turn is still wrong if it leads nowhere. On many liquid intraday markets the Edge sits near zero; check it before trusting a turn.
Nota Keluaran
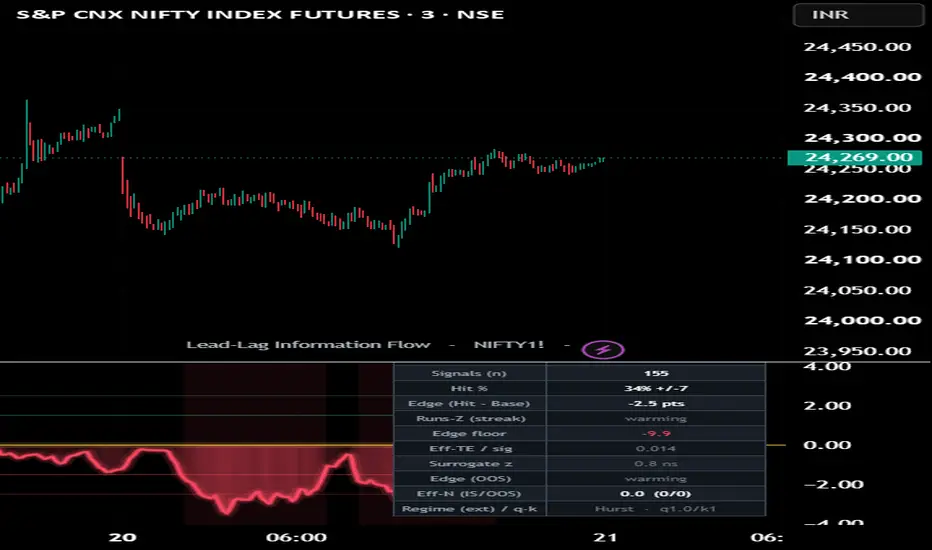
v3.0 — Surrogate significance, Rényi-q TE, embedding, regime backbone, honest OOS harness, and a cleaner readSURROGATE significance — the observed net TE is now tested against a time-shift surrogate null (the source is shifted out of alignment); a z and a ✓/ns flag tell you whether the lead beats chance. This closes the gap the old header flagged.
RÉNYI-q transfer entropy — tunable order q (1 = classic Shannon; q>1 emphasises common transitions, q<1 the rare/tail ones), plus optional target embedding of 2 past states. q=1, embedding 1 reproduces v2.
REGIME★ — optionally link EXP_Regime from the Market Regime Classifier to require a trending follower.
HARNESS+ — uniqueness-weighted effective sample size, in-sample/out-of-sample split (the OOS edge is the one to trust), and a deflated significance bar.
Cleaner read: the pane is now a normalized, banded oscillator by default (flow scaled to its own σ, sign = lead direction) for a conventional RSI/MACD-style view; follow signals also plot on the price chart as tiny green-up / red-down triangles.
Signals are now rare, cooled-down and surrogate-gated by default (no more one mark per bar), and the dashboard leads with a plain verdict — from "no significant lead-lag" to "exploitable lead-lag ✓" — so the tool stays quiet on pairs with no genuine information flow. Point the Reference at a genuinely different leader (not the chart's own instrument) for it to be useful.
Descriptive lead-lag study; surrogate and forward statistics are in-sample/on-pair, not investment advice.
Skrip sumber terbuka
Dalam semangat TradingView sebenar, pencipta skrip ini telah menjadikannya sumber terbuka, jadi pedagang boleh menilai dan mengesahkan kefungsiannya. Terima kasih kepada penulis! Walaupuan anda boleh menggunakan secara percuma, ingat bahawa penerbitan semula kod ini tertakluk kepada Peraturan Dalaman.

Penafian
Maklumat dan penerbitan adalah tidak bertujuan, dan tidak membentuk, nasihat atau cadangan kewangan, pelaburan, dagangan atau jenis lain yang diberikan atau disahkan oleh TradingView. Baca lebih dalam Terma Penggunaan.
Skrip sumber terbuka
Dalam semangat TradingView sebenar, pencipta skrip ini telah menjadikannya sumber terbuka, jadi pedagang boleh menilai dan mengesahkan kefungsiannya. Terima kasih kepada penulis! Walaupuan anda boleh menggunakan secara percuma, ingat bahawa penerbitan semula kod ini tertakluk kepada Peraturan Dalaman.
Penafian
Maklumat dan penerbitan adalah tidak bertujuan, dan tidak membentuk, nasihat atau cadangan kewangan, pelaburan, dagangan atau jenis lain yang diberikan atau disahkan oleh TradingView. Baca lebih dalam Terma Penggunaan.