OPEN-SOURCE SCRIPT
Case's Modern MACD-Volatility Normalized Momentum
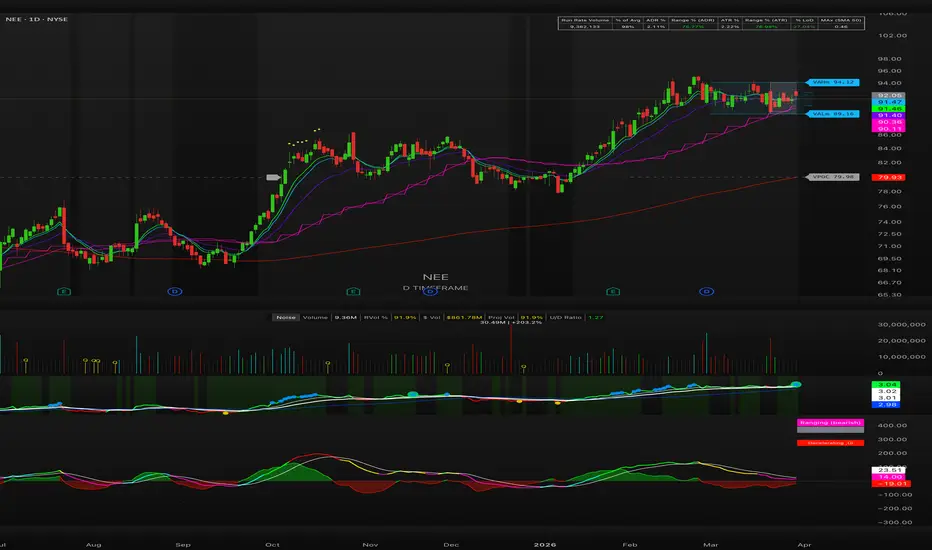
Case's Modern MACD-Volatility Normalized Momentum
Based on the award-winning academic research of Alex Spiroglou, CFTe, MSTA — NAAIM Founders Award & Charles H. Dow Award (2022)
📄 Original paper: SSRN #4099617
What Is MACD-V?
The standard MACD has a fundamental flaw: its raw values are denominated in price, making them incomparable across assets, timeframes, and volatility regimes. A MACD reading of 5.0 means something completely different on NVDA vs. SPY vs. BTC.
MACD-V solves this by dividing the MACD by ATR × 100, producing a volatility-normalized momentum oscillator that is:
Comparable across all tickers and timeframes
Centered around fixed, meaningful thresholds (±50, ±150, ±200)
Regime-aware — you know exactly where you stand in the momentum lifecycle at all times
This script extends the core MACD-V framework with a full Momentum Lifecycle Road Map, Trend Regime Filter, Regime-Aware Opportunity Zones, Acceleration (2nd Derivative), and several supporting systems.
Core Components
1. MACD-V Line
The volatility-normalized momentum line. Default parameters: Fast EMA 12, Slow EMA 26, ATR 26 — the same as classic MACD, but normalized. The line is color-coded by momentum state (see Momentum Lifecycle below).
2. Signal Line
A 9-period EMA of MACD-V. Crossovers and the MACD-V's position relative to the signal define sub-states within each momentum zone.
3. MACD-VH Histogram
The difference between MACD-V and its Signal Line. Color-coded by direction and growth:
Teal (growing positive) — bullish momentum expanding
Light teal (shrinking positive) — bullish momentum fading
Light red (rising negative) — bearish momentum fading
Red (falling negative) — bearish momentum expanding
Extreme histogram readings beyond ±40 signal short-term overextension.
4. Acceleration (2nd Derivative)
A smoothed EMA of the bar-to-bar change in MACD-V, scaled for visibility. Think of it as the rate of change of momentum. When acceleration is positive (teal), momentum is building. When negative (red), it's waning — even if the MACD-V line itself is still rising. This is particularly powerful for timing entries and exits.
The Momentum Lifecycle Road Map
MACD-V's fixed thresholds carve price momentum into 8 distinct states, each with a precise behavioral expectation:
StateMACD-V Rangevs. SignalColorInterpretationRisk (Overbought)> 150—🔴 RedMomentum extended; risk of reversal or correctionRallying50 to 150Above🟢 GreenStrong bullish momentum with trend confirmationRetracing50 to 150Below🟠 OrangeBullish zone but losing momentum; cautionRanging (Bullish)-50 to 50Above🩵 TealConsolidation with bullish biasRanging (Bearish)-50 to 50Below🔴 RedConsolidation with bearish biasRebounding-150 to -50Above🟢 Light GreenRecovering from oversold; potential reversalReversing-150 to -50Below🟣 PurpleBearish zone, still decliningRisk (Oversold)< -150—🔴 RedMomentum deeply negative; exhaustion risk/opportunity
A status table in the top-right corner always shows the current state, trend regime, opportunity zone, and acceleration direction — no squinting at the chart required.
Trend Regime Filter (200 EMA Slope)
A row of dots plotted below the oscillator, colored by the slope of the 200-period EMA:
🟢 Green — Rising 200 EMA → Bullish Regime
🔴 Red — Falling 200 EMA → Bearish Regime
⚫ Gray — Flat → Neutral Regime
This single filter dramatically changes how you interpret every other signal on the indicator.
Regime-Aware Opportunity Zones
This is where the indicator gets powerful for active traders. The trend regime context transforms oversold/overbought readings into actionable setups:
🟢 Bull Regime Signals (200 EMA rising)
SignalConditionMeaningBuy the Dip ZoneMACD-V between -50 and -150Normal pullback in an uptrend — historically high-probability long entryRare Buy!MACD-V ≤ -100Deep dip in bull trend — a rarer, higher-conviction setupExtreme OB WarningMACD-V > 200Even in a bull regime, this level of extension warrants caution
🔴 Bear Regime Signals (200 EMA falling)
SignalConditionMeaningShort the Rip ZoneMACD-V between 50 and 150Counter-trend bounce in a downtrend — potential short entryRare Short!MACD-V ≥ 100Extended rip in a bear regime — rarer, higher-conviction short setupExtreme OS OpportunityMACD-V < -200Even in a bear regime, this extreme may offer a tradeable bounce
Zones are highlighted with background color fills and shape markers (triangles for zone entries, diamonds for rare signals) at the pane edges.
How to Use It: Practical Examples
Example 1: Buying the Dip in a Bull Trend
Scenario: SPY, daily chart. 200 EMA is rising (green dots). MACD-V drops from +80 (Rallying) into the -50 to -150 range.
Regime dots turn green → confirmed bull regime
Status table shows "Buy the Dip Zone" with green background
MACD-V hits -90, acceleration flips positive (teal area)
MACD-V crosses above signal line → state transitions from Reversing to Rebounding
Entry signal: long on the Rebounding transition with acceleration confirming. Stop below the prior swing low. Target: return to Rallying zone (+50 to +150)
Example 2: Shorting the Rip in a Bear Trend
Scenario: QQQ, daily chart. 200 EMA is falling (red dots). After a sharp decline, price bounces and MACD-V pushes up toward +80.
Regime dots are red → confirmed bear regime
MACD-V enters the 50–150 range → "Short the Rip Zone" activates
Histogram begins shrinking (light teal → light red)
Acceleration turns negative while MACD-V is still above +50
MACD-V crosses below signal line → Rallying → Retracing state change
Entry signal: short on the Retracing state entry. Target: return to Ranging or lower
Example 3: Identifying Exhaustion at Extremes
Scenario: Individual stock surges — MACD-V blows past +150 into Risk (Overbought) and then crosses +200 (Extreme OB).
Status table shows "Risk (Overbought)" — position sizing should be reduced
MACD-V crosses +200 → Extreme OB background activates (dark red)
If in a bull regime: the "Extreme OB Warning" marker fires at the pane ceiling — this is a warning to tighten stops or take partial profits, not necessarily to go short outright
Acceleration turns negative while MACD-V is still above 150 → divergence between price extension and momentum rate-of-change
Watch for MACD-V to turn down and re-enter the 50–150 Rallying zone — that first pullback often offers the next long entry
Example 4: Reading the Histogram for Short-Term Timing
Scenario: You've identified a bullish setup but want better entry timing.
MACD-V is in Ranging (Bullish) (-50 to 50, above signal)
Histogram is positive but shrinking (light teal) — don't chase yet
Wait for histogram to grow again (dark teal bars) → momentum is re-accelerating
Acceleration area flips from red to teal → confirmation
This sequence often pinpoints within 1-2 bars of the optimal entry
Example 5: The Bearish Divergence Setup
Scenario: A stock is below its daily 200 SMA but MACD-V is in the Rebounding or Reversing zone.
Price is in a longer-term downtrend (below 200 SMA)
A light blue background appears — this is the bearish divergence warning: short-term momentum is recovering, but the bigger picture remains weak
Use this signal to fade bounces or simply avoid longs until the regime and trend realign
Supporting Systems (Optional)
LBR 3/10 Oscillator (Sardine)
Linda Bradford Raschke's classic short-term momentum oscillator, volatility-normalized using the same MACD-V methodology. Toggle on to use as a leading signal for MACD-V crossovers — the 3/10 typically turns before the 12/26.
Elder Impulse Plus Bar Coloring
Combines the direction of a 13-period EMA with the direction of the MACD-VH histogram to color price bars:
🟢 Green: EMA rising + histogram expanding positive → buy
🔴 Red: EMA falling + histogram expanding negative → sell/avoid longs
🔵 Blue: Mixed signals → stand aside
Built-In Alerts
The indicator includes 18 alert conditions, covering:
MACD-V / Signal Line crossovers (bullish & bearish)
Zero line crossovers
Entry into all 8 momentum lifecycle states
Extreme regime signals (Bull + >200, Bear + <-200)
MACD-VH overbought/oversold extremes (±40)
MACD-V direction changes (turned up / turned down)
Set alerts on any condition without having to stay glued to the chart.
Pine Screener Compatible
Four numeric values are plotted to the Data Window for use with TradingView's Pine Screener:
Momentum State # (4 to -4)
MACD-V Direction (1, 0, -1)
Trend Regime # (1, 0, -1)
Acceleration Direction (1, -1)
Screen entire watchlists for, e.g., "Bull regime + Momentum State = Rebounding + Acceleration positive" — a powerful combination for systematic scan-based trading.
Settings Reference
ParameterDefaultPurposeFast / Slow EMA12 / 26MACD-V core calculationATR Length26Volatility normalizationSignal Line9EMA of MACD-VRisk Levels±150Overbought/oversold thresholdsFast/Slow Boundary±50Momentum zone boundariesTrend EMA Length200Regime filterRare Buy/Short Level±100Rare signal thresholdsExtreme Level±200Extreme zone definitionAccel Smooth / Scale5 / 4.0Acceleration sensitivity
Credits & Disclaimer
This indicator is a heavily extended implementation of the MACD-V framework developed by Alex Spiroglou, winner of the 2022 NAAIM Founders Award and Charles H. Dow Award. Full academic methodology is available in the original paper linked above.
This script is published for educational and analytical purposes only. Nothing here constitutes financial advice. All trading involves risk. Past performance of any indicator is not indicative of future results.
Based on the award-winning academic research of Alex Spiroglou, CFTe, MSTA — NAAIM Founders Award & Charles H. Dow Award (2022)
📄 Original paper: SSRN #4099617
What Is MACD-V?
The standard MACD has a fundamental flaw: its raw values are denominated in price, making them incomparable across assets, timeframes, and volatility regimes. A MACD reading of 5.0 means something completely different on NVDA vs. SPY vs. BTC.
MACD-V solves this by dividing the MACD by ATR × 100, producing a volatility-normalized momentum oscillator that is:
Comparable across all tickers and timeframes
Centered around fixed, meaningful thresholds (±50, ±150, ±200)
Regime-aware — you know exactly where you stand in the momentum lifecycle at all times
This script extends the core MACD-V framework with a full Momentum Lifecycle Road Map, Trend Regime Filter, Regime-Aware Opportunity Zones, Acceleration (2nd Derivative), and several supporting systems.
Core Components
1. MACD-V Line
The volatility-normalized momentum line. Default parameters: Fast EMA 12, Slow EMA 26, ATR 26 — the same as classic MACD, but normalized. The line is color-coded by momentum state (see Momentum Lifecycle below).
2. Signal Line
A 9-period EMA of MACD-V. Crossovers and the MACD-V's position relative to the signal define sub-states within each momentum zone.
3. MACD-VH Histogram
The difference between MACD-V and its Signal Line. Color-coded by direction and growth:
Teal (growing positive) — bullish momentum expanding
Light teal (shrinking positive) — bullish momentum fading
Light red (rising negative) — bearish momentum fading
Red (falling negative) — bearish momentum expanding
Extreme histogram readings beyond ±40 signal short-term overextension.
4. Acceleration (2nd Derivative)
A smoothed EMA of the bar-to-bar change in MACD-V, scaled for visibility. Think of it as the rate of change of momentum. When acceleration is positive (teal), momentum is building. When negative (red), it's waning — even if the MACD-V line itself is still rising. This is particularly powerful for timing entries and exits.
The Momentum Lifecycle Road Map
MACD-V's fixed thresholds carve price momentum into 8 distinct states, each with a precise behavioral expectation:
StateMACD-V Rangevs. SignalColorInterpretationRisk (Overbought)> 150—🔴 RedMomentum extended; risk of reversal or correctionRallying50 to 150Above🟢 GreenStrong bullish momentum with trend confirmationRetracing50 to 150Below🟠 OrangeBullish zone but losing momentum; cautionRanging (Bullish)-50 to 50Above🩵 TealConsolidation with bullish biasRanging (Bearish)-50 to 50Below🔴 RedConsolidation with bearish biasRebounding-150 to -50Above🟢 Light GreenRecovering from oversold; potential reversalReversing-150 to -50Below🟣 PurpleBearish zone, still decliningRisk (Oversold)< -150—🔴 RedMomentum deeply negative; exhaustion risk/opportunity
A status table in the top-right corner always shows the current state, trend regime, opportunity zone, and acceleration direction — no squinting at the chart required.
Trend Regime Filter (200 EMA Slope)
A row of dots plotted below the oscillator, colored by the slope of the 200-period EMA:
🟢 Green — Rising 200 EMA → Bullish Regime
🔴 Red — Falling 200 EMA → Bearish Regime
⚫ Gray — Flat → Neutral Regime
This single filter dramatically changes how you interpret every other signal on the indicator.
Regime-Aware Opportunity Zones
This is where the indicator gets powerful for active traders. The trend regime context transforms oversold/overbought readings into actionable setups:
🟢 Bull Regime Signals (200 EMA rising)
SignalConditionMeaningBuy the Dip ZoneMACD-V between -50 and -150Normal pullback in an uptrend — historically high-probability long entryRare Buy!MACD-V ≤ -100Deep dip in bull trend — a rarer, higher-conviction setupExtreme OB WarningMACD-V > 200Even in a bull regime, this level of extension warrants caution
🔴 Bear Regime Signals (200 EMA falling)
SignalConditionMeaningShort the Rip ZoneMACD-V between 50 and 150Counter-trend bounce in a downtrend — potential short entryRare Short!MACD-V ≥ 100Extended rip in a bear regime — rarer, higher-conviction short setupExtreme OS OpportunityMACD-V < -200Even in a bear regime, this extreme may offer a tradeable bounce
Zones are highlighted with background color fills and shape markers (triangles for zone entries, diamonds for rare signals) at the pane edges.
How to Use It: Practical Examples
Example 1: Buying the Dip in a Bull Trend
Scenario: SPY, daily chart. 200 EMA is rising (green dots). MACD-V drops from +80 (Rallying) into the -50 to -150 range.
Regime dots turn green → confirmed bull regime
Status table shows "Buy the Dip Zone" with green background
MACD-V hits -90, acceleration flips positive (teal area)
MACD-V crosses above signal line → state transitions from Reversing to Rebounding
Entry signal: long on the Rebounding transition with acceleration confirming. Stop below the prior swing low. Target: return to Rallying zone (+50 to +150)
Example 2: Shorting the Rip in a Bear Trend
Scenario: QQQ, daily chart. 200 EMA is falling (red dots). After a sharp decline, price bounces and MACD-V pushes up toward +80.
Regime dots are red → confirmed bear regime
MACD-V enters the 50–150 range → "Short the Rip Zone" activates
Histogram begins shrinking (light teal → light red)
Acceleration turns negative while MACD-V is still above +50
MACD-V crosses below signal line → Rallying → Retracing state change
Entry signal: short on the Retracing state entry. Target: return to Ranging or lower
Example 3: Identifying Exhaustion at Extremes
Scenario: Individual stock surges — MACD-V blows past +150 into Risk (Overbought) and then crosses +200 (Extreme OB).
Status table shows "Risk (Overbought)" — position sizing should be reduced
MACD-V crosses +200 → Extreme OB background activates (dark red)
If in a bull regime: the "Extreme OB Warning" marker fires at the pane ceiling — this is a warning to tighten stops or take partial profits, not necessarily to go short outright
Acceleration turns negative while MACD-V is still above 150 → divergence between price extension and momentum rate-of-change
Watch for MACD-V to turn down and re-enter the 50–150 Rallying zone — that first pullback often offers the next long entry
Example 4: Reading the Histogram for Short-Term Timing
Scenario: You've identified a bullish setup but want better entry timing.
MACD-V is in Ranging (Bullish) (-50 to 50, above signal)
Histogram is positive but shrinking (light teal) — don't chase yet
Wait for histogram to grow again (dark teal bars) → momentum is re-accelerating
Acceleration area flips from red to teal → confirmation
This sequence often pinpoints within 1-2 bars of the optimal entry
Example 5: The Bearish Divergence Setup
Scenario: A stock is below its daily 200 SMA but MACD-V is in the Rebounding or Reversing zone.
Price is in a longer-term downtrend (below 200 SMA)
A light blue background appears — this is the bearish divergence warning: short-term momentum is recovering, but the bigger picture remains weak
Use this signal to fade bounces or simply avoid longs until the regime and trend realign
Supporting Systems (Optional)
LBR 3/10 Oscillator (Sardine)
Linda Bradford Raschke's classic short-term momentum oscillator, volatility-normalized using the same MACD-V methodology. Toggle on to use as a leading signal for MACD-V crossovers — the 3/10 typically turns before the 12/26.
Elder Impulse Plus Bar Coloring
Combines the direction of a 13-period EMA with the direction of the MACD-VH histogram to color price bars:
🟢 Green: EMA rising + histogram expanding positive → buy
🔴 Red: EMA falling + histogram expanding negative → sell/avoid longs
🔵 Blue: Mixed signals → stand aside
Built-In Alerts
The indicator includes 18 alert conditions, covering:
MACD-V / Signal Line crossovers (bullish & bearish)
Zero line crossovers
Entry into all 8 momentum lifecycle states
Extreme regime signals (Bull + >200, Bear + <-200)
MACD-VH overbought/oversold extremes (±40)
MACD-V direction changes (turned up / turned down)
Set alerts on any condition without having to stay glued to the chart.
Pine Screener Compatible
Four numeric values are plotted to the Data Window for use with TradingView's Pine Screener:
Momentum State # (4 to -4)
MACD-V Direction (1, 0, -1)
Trend Regime # (1, 0, -1)
Acceleration Direction (1, -1)
Screen entire watchlists for, e.g., "Bull regime + Momentum State = Rebounding + Acceleration positive" — a powerful combination for systematic scan-based trading.
Settings Reference
ParameterDefaultPurposeFast / Slow EMA12 / 26MACD-V core calculationATR Length26Volatility normalizationSignal Line9EMA of MACD-VRisk Levels±150Overbought/oversold thresholdsFast/Slow Boundary±50Momentum zone boundariesTrend EMA Length200Regime filterRare Buy/Short Level±100Rare signal thresholdsExtreme Level±200Extreme zone definitionAccel Smooth / Scale5 / 4.0Acceleration sensitivity
Credits & Disclaimer
This indicator is a heavily extended implementation of the MACD-V framework developed by Alex Spiroglou, winner of the 2022 NAAIM Founders Award and Charles H. Dow Award. Full academic methodology is available in the original paper linked above.
This script is published for educational and analytical purposes only. Nothing here constitutes financial advice. All trading involves risk. Past performance of any indicator is not indicative of future results.
Skrip sumber terbuka
Dalam semangat TradingView sebenar, pencipta skrip ini telah menjadikannya sumber terbuka, jadi pedagang boleh menilai dan mengesahkan kefungsiannya. Terima kasih kepada penulis! Walaupuan anda boleh menggunakan secara percuma, ingat bahawa penerbitan semula kod ini tertakluk kepada Peraturan Dalaman.

Penafian
Maklumat dan penerbitan adalah tidak bertujuan, dan tidak membentuk, nasihat atau cadangan kewangan, pelaburan, dagangan atau jenis lain yang diberikan atau disahkan oleh TradingView. Baca lebih dalam Terma Penggunaan.
Skrip sumber terbuka
Dalam semangat TradingView sebenar, pencipta skrip ini telah menjadikannya sumber terbuka, jadi pedagang boleh menilai dan mengesahkan kefungsiannya. Terima kasih kepada penulis! Walaupuan anda boleh menggunakan secara percuma, ingat bahawa penerbitan semula kod ini tertakluk kepada Peraturan Dalaman.
Penafian
Maklumat dan penerbitan adalah tidak bertujuan, dan tidak membentuk, nasihat atau cadangan kewangan, pelaburan, dagangan atau jenis lain yang diberikan atau disahkan oleh TradingView. Baca lebih dalam Terma Penggunaan.