Meanward Revert Zones
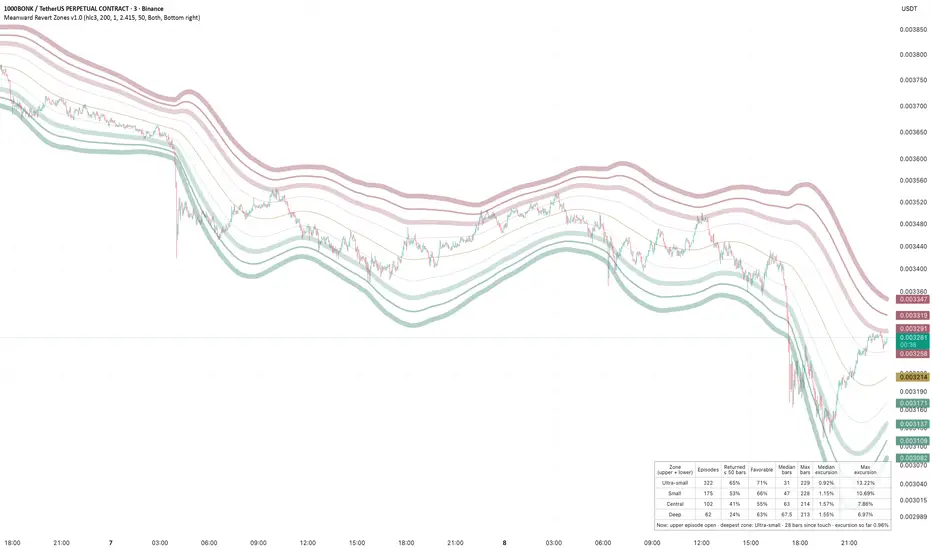
A mean-reversion channel with four depth zones and a statistics table that answers one question: when price stretched this far from its mean on this symbol and timeframe, how did it come back?
What it shows
How episodes are counted
An episode starts when a bar's high touches the first upper zone (or its low touches the first lower zone) and ends when price touches the mean line again. Each zone row includes every finished episode that reached that zone, measured from the bar of the touch. Only closed bars are counted, so the numbers don't repaint.
The columns
How to read it
How to use it in a trading plan
The table doesn't tell you when to enter. It tells you what a mean-reversion plan has to survive on this symbol and timeframe. Five checks before you put money on a channel:
The "Now" row is context, not a trigger. An open episode that's already past the median bars and excursion for its zone is in the tail, and the tail is where the table has the least data.
What it isn't
There are no buy or sell signals and no alerts in this script. It describes what already happened on the loaded history. How a channel behaved before says nothing certain about the next touch.
Settings
Price source, channel length and the two band multipliers control the channel. Return window sets N. Side limits the table to upper or lower zones, which is useful when a symbol stretches up and down differently. The table can be hidden or moved to any corner.
Limits
The table covers only the bars your chart loads, so deeper history gives steadier numbers. The first bars, while the filter warms up, start no episodes. The open episode isn't included until it finishes.
Credits
The channel core is a Pine v6 port of "Mean Reversion Channel - (fareid's MRI Variant)" by fareidzulkifli, reused with credit as its author allows. The SuperSmoother filter comes from John Ehlers' work. New here: the named zones, episode tracking and the return statistics table.
What it shows
- The channel. A SuperSmoother mean line (default: hlc3, 200 bars) with an inner and an outer band built from the smoothed true range.
- Four zones on each side of the mean: Ultra-small (the inner band), Small, Central (the outer band) and Deep. Each boundary sits at a fixed distance from the outer band, measured in units of smoothed range.
- The table. One row per zone, counted over the bars loaded on your chart.
- A "Now" row: whether a stretch is open right now, how deep it went and how many bars it has lasted.
How episodes are counted
An episode starts when a bar's high touches the first upper zone (or its low touches the first lower zone) and ends when price touches the mean line again. Each zone row includes every finished episode that reached that zone, measured from the bar of the touch. Only closed bars are counted, so the numbers don't repaint.
The columns
- Episodes: how many finished episodes reached the zone.
- Returned ≤ N bars: the share that got back to the mean within N bars of the touch (N is a setting, 50 by default).
- Favorable: the share where the mean, at the moment of return, was on the better side of the touch level. Below it for upper zones, above it for lower ones.
- Median bars, Max bars: how long the return took.
- Median excursion, Max excursion: how far price kept going past the touch level before it returned, in percent.
How to read it
- Check Episodes first. Five episodes aren't statistics.
- A low Favorable share means price "returned" mostly because the mean caught up with it. Touching the mean isn't the same as getting a better price.
- Max bars and Max excursion are the tail. That's the row to study before you plan any averaging, not the median.
- Compare symbols and timeframes. The same zone behaves very differently on a 5m small-cap and a 4h major.
How to use it in a trading plan
The table doesn't tell you when to enter. It tells you what a mean-reversion plan has to survive on this symbol and timeframe. Five checks before you put money on a channel:
- Where to trade. Run the table over your shortlist of symbols and timeframes. A market with plenty of episodes, a high Favorable share and a short Max bars fits the channel better than one where returns are slow and mostly unfavorable.
- Which zone. Compare the rows. A deeper zone gives fewer episodes, and it doesn't automatically give a better Favorable share. Choose by the row, not by the name of the zone.
- Where the target is. Favorable is roughly the share of episodes where "enter at the zone, exit at the mean" closed in profit before fees. At 60%, four touches out of ten came back to the mean at a worse price than the entry, so the mean line alone is a weak target there.
- How much room the position needs. Excursion is how far price went against an entry at the touch level, in percent of price, before leverage. Size the position and space any averaging steps against Max excursion, not the median: the median is the usual case, the max is the one your margin has to cover.
- How long it can take. Multiply Median bars and Max bars by the timeframe. 250 bars on 15m is about 2.5 days in a position. If that's longer than you're ready to hold, change the timeframe or plan a time limit.
The "Now" row is context, not a trigger. An open episode that's already past the median bars and excursion for its zone is in the tail, and the tail is where the table has the least data.
What it isn't
There are no buy or sell signals and no alerts in this script. It describes what already happened on the loaded history. How a channel behaved before says nothing certain about the next touch.
Settings
Price source, channel length and the two band multipliers control the channel. Return window sets N. Side limits the table to upper or lower zones, which is useful when a symbol stretches up and down differently. The table can be hidden or moved to any corner.
Limits
The table covers only the bars your chart loads, so deeper history gives steadier numbers. The first bars, while the filter warms up, start no episodes. The open episode isn't included until it finishes.
Credits
The channel core is a Pine v6 port of "Mean Reversion Channel - (fareid's MRI Variant)" by fareidzulkifli, reused with credit as its author allows. The SuperSmoother filter comes from John Ehlers' work. New here: the named zones, episode tracking and the return statistics table.

Meanward: trading systems you configure and test yourself. Releases, backtests and drawdowns: t.me/meanward
Penafian
Maklumat dan penerbitan adalah tidak bertujuan, dan tidak membentuk, nasihat atau cadangan kewangan, pelaburan, dagangan atau jenis lain yang diberikan atau disahkan oleh TradingView. Baca lebih dalam Terma Penggunaan.
Meanward: trading systems you configure and test yourself. Releases, backtests and drawdowns: t.me/meanward
Penafian
Maklumat dan penerbitan adalah tidak bertujuan, dan tidak membentuk, nasihat atau cadangan kewangan, pelaburan, dagangan atau jenis lain yang diberikan atau disahkan oleh TradingView. Baca lebih dalam Terma Penggunaan.