DTC EMA Trend Cloud
OVERVIEW
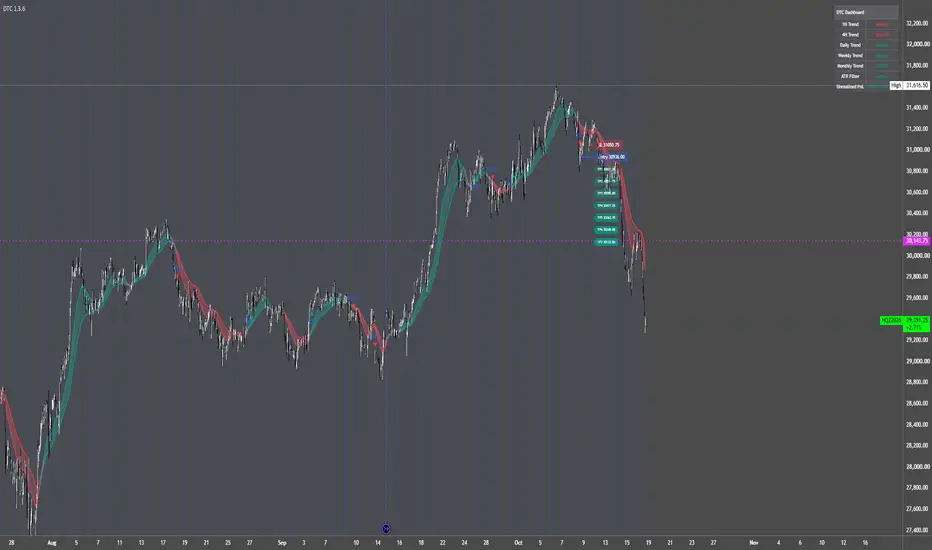
DTC EMA Trend Cloud combines a six-EMA alignment model, an optional ATR volatility filter, multi-timeframe trend context, and projected risk levels in one chart overlay.
The indicator helps traders visualize trend structure and evaluate potential setups using consistent rules. It is an analytical indicator, not an automated trading strategy.
EMA TREND ENGINE
The system uses six exponential moving averages with default lengths of 30, 35, 40, 45, 50, and 60.
The cloud between the shortest and longest EMAs changes color with the alignment state. The remaining EMAs show the internal structure of the ribbon.
All six EMA lengths and trend colors are customizable.
BUY AND SELL SIGNALS
Signals identify changes into an aligned trend state. They do not appear on every bar of an established trend.
When the ATR filter is enabled, the alignment transition must also meet the volatility requirement. If that transition is filtered out, a delayed signal will not appear simply because volatility increases later.
Turning off “Show Buy/Sell Signals” also disables the associated signal alerts and new signal-based level updates.
ATR VOLATILITY FILTER
The optional filter compares current ATR with its moving average:
Current ATR > Average ATR × Threshold Multiplier
Default settings:
Increasing the multiplier makes the volatility requirement more restrictive.
The filter affects signal eligibility only. It does not change the EMA cloud or the dashboard’s trend classifications. ATR measures volatility, not direction.
PROJECTED ENTRY, STOP AND TARGETS
Each eligible signal can display:
Available stop distances:
R represents the distance between the reference entry and the projected stop.
Levels are calculated from the signal and projected forward by the selected number of bars. A new signal replaces the previous set of drawings. These levels do not trail price or automatically update when a target or stop is touched.
The displayed levels are planning references—not executed orders, guaranteed fills, or predictions that targets will be reached.
MULTI-TIMEFRAME DASHBOARD
The dashboard independently evaluates the same six-EMA alignment model on:
Each timeframe is classified as Bullish, Bearish, or Neutral.
These readings provide context rather than mandatory entry confirmation. Chart-timeframe signals do not require agreement from the dashboard.
The dashboard also includes:
Despite its label, “Unrealized PnL” is not actual account profit. It does not account for position size, contract value, commissions, slippage, or exits at the displayed stop and targets.
SUGGESTED WORKFLOW
LIVE-BAR BEHAVIOR
Signals are not explicitly restricted to closed candles.
Markers and projected levels can change or disappear while the current candle develops. For close-based notifications, select “Once Per Bar Close” when creating an alert.
Multi-timeframe dashboard readings use developing timeframe data and can change before those candles close. The indicator should not be treated as non-repainting.
LIMITATIONS
DISCLAIMER
For educational and analytical use only. This indicator does not provide personalized financial advice or guarantee trading results. Trading involves risk, and users are responsible for their own analysis, position sizing, and execution decisions.
DTC EMA Trend Cloud combines a six-EMA alignment model, an optional ATR volatility filter, multi-timeframe trend context, and projected risk levels in one chart overlay.
The indicator helps traders visualize trend structure and evaluate potential setups using consistent rules. It is an analytical indicator, not an automated trading strategy.
EMA TREND ENGINE
The system uses six exponential moving averages with default lengths of 30, 35, 40, 45, 50, and 60.
- Bullish: All six EMAs are stacked from shortest above longest.
- Bearish: All six EMAs are stacked from shortest below longest.
- Neutral: Neither full bullish nor full bearish alignment is present.
The cloud between the shortest and longest EMAs changes color with the alignment state. The remaining EMAs show the internal structure of the ribbon.
All six EMA lengths and trend colors are customizable.
BUY AND SELL SIGNALS
- BUY: The chart transitions into full bullish EMA alignment.
- SELL: The chart transitions into full bearish EMA alignment.
Signals identify changes into an aligned trend state. They do not appear on every bar of an established trend.
When the ATR filter is enabled, the alignment transition must also meet the volatility requirement. If that transition is filtered out, a delayed signal will not appear simply because volatility increases later.
Turning off “Show Buy/Sell Signals” also disables the associated signal alerts and new signal-based level updates.
ATR VOLATILITY FILTER
The optional filter compares current ATR with its moving average:
Current ATR > Average ATR × Threshold Multiplier
Default settings:
- ATR period: 14
- ATR average period: 50
- Threshold multiplier: 1.0
Increasing the multiplier makes the volatility requirement more restrictive.
The filter affects signal eligibility only. It does not change the EMA cloud or the dashboard’s trend classifications. ATR measures volatility, not direction.
PROJECTED ENTRY, STOP AND TARGETS
Each eligible signal can display:
- A reference entry at the signal bar’s closing price
- An ATR-based stop level
- Seven targets spaced at 1R through 7R
Available stop distances:
- Tiny: 0.5 × ATR
- Small: 1.0 × ATR
- Mid: 1.5 × ATR
- Large: 2.0 × ATR
R represents the distance between the reference entry and the projected stop.
Levels are calculated from the signal and projected forward by the selected number of bars. A new signal replaces the previous set of drawings. These levels do not trail price or automatically update when a target or stop is touched.
The displayed levels are planning references—not executed orders, guaranteed fills, or predictions that targets will be reached.
MULTI-TIMEFRAME DASHBOARD
The dashboard independently evaluates the same six-EMA alignment model on:
- 1-hour
- 4-hour
- Daily
- Weekly
- Monthly
Each timeframe is classified as Bullish, Bearish, or Neutral.
These readings provide context rather than mandatory entry confirmation. Chart-timeframe signals do not require agreement from the dashboard.
The dashboard also includes:
- ATR Filter: Shows whether the current ATR threshold is met. This status remains visible even when the optional signal filter is disabled.
- Unrealized PnL: Shows directional price movement, in price units and percentage, since the latest signal.
Despite its label, “Unrealized PnL” is not actual account profit. It does not account for position size, contract value, commissions, slippage, or exits at the displayed stop and targets.
SUGGESTED WORKFLOW
- Review the dashboard for broader trend context.
- Use the EMA cloud to identify bullish, bearish, or mixed chart structure.
- Evaluate new alignment signals alongside your own market analysis.
- Use the projected levels to assess potential risk and reward.
- Adjust the EMA lengths and volatility settings to suit the instrument and timeframe.
LIVE-BAR BEHAVIOR
Signals are not explicitly restricted to closed candles.
Markers and projected levels can change or disappear while the current candle develops. For close-based notifications, select “Once Per Bar Close” when creating an alert.
Multi-timeframe dashboard readings use developing timeframe data and can change before those candles close. The indicator should not be treated as non-repainting.
LIMITATIONS
- EMA alignment is lagging and may generate repeated transitions in sideways markets.
- The ATR filter does not guarantee trend continuation or signal success.
- Displayed targets and stops are visual references and do not track trade outcomes.
- This indicator does not calculate verified win rate, expectancy, or strategy returns.
- No instrument or timeframe is guaranteed to perform well with the default settings.
DISCLAIMER
For educational and analytical use only. This indicator does not provide personalized financial advice or guarantee trading results. Trading involves risk, and users are responsible for their own analysis, position sizing, and execution decisions.

Penafian
Maklumat dan penerbitan adalah tidak bertujuan, dan tidak membentuk, nasihat atau cadangan kewangan, pelaburan, dagangan atau jenis lain yang diberikan atau disahkan oleh TradingView. Baca lebih dalam Terma Penggunaan.
Penafian
Maklumat dan penerbitan adalah tidak bertujuan, dan tidak membentuk, nasihat atau cadangan kewangan, pelaburan, dagangan atau jenis lain yang diberikan atau disahkan oleh TradingView. Baca lebih dalam Terma Penggunaan.