OPEN-SOURCE SCRIPT
Up/Dn Volume Sentiment Strategy
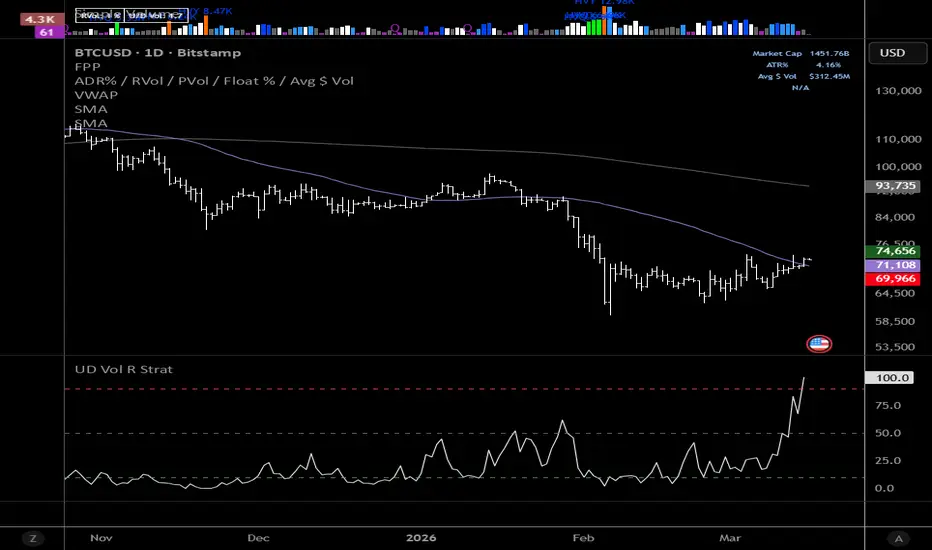
**Volume Sentiment Oscillator Strategy (Up/Down Volume, Mean Reversion, R-Multiple Risk Management)**
This strategy converts the Up/Down Volume Ratio into a normalized sentiment oscillator designed to identify potential exhaustion in buying or selling pressure. The idea is that when trading volume becomes heavily skewed toward one side of the market, sentiment may be reaching an extreme that can lead to a reversal or mean-reversion move.
The script calculates buying pressure as the volume occurring on bars that close higher than the previous bar, and selling pressure as the volume occurring on bars that close lower. These values are smoothed and converted into an Up/Down Volume Ratio. That ratio is then normalized over a configurable historical range (default: three years) to produce a **0–100 sentiment oscillator**.
This normalization allows traders to quickly see when the current level of buying or selling pressure is historically extreme.
**Strategy logic**
• Long positions open when the sentiment oscillator drops below a configurable oversold threshold (default: 10).
• Short positions open when the oscillator rises above a configurable overbought threshold (default: 90).
These thresholds represent situations where participation becomes heavily one-sided.
**Risk management**
Risk is defined as a percentage distance from the entry price (default: 5%).
Profit targets are expressed in **R multiples**, where:
• 1R = the distance from entry to stop loss
• 2R = twice the stop distance
• 3R = three times the stop distance
Using R-based exits allows traders to experiment with different reward-to-risk profiles and analyze how exit logic affects the system's expectancy.
**Configurable inputs**
• Up/Down volume smoothing length
• Normalization lookback period
• Long entry threshold
• Short entry threshold
• Stop-loss percentage
• Profit target (R multiple)
**Use cases**
This strategy can be used as a research tool to study how extreme participation levels influence price behavior. It may be applied across stocks, indexes, and other liquid markets to evaluate mean-reversion tendencies driven by volume imbalance.
As with any systematic model, traders should test across multiple markets and timeframes to understand its strengths and limitations.
This strategy converts the Up/Down Volume Ratio into a normalized sentiment oscillator designed to identify potential exhaustion in buying or selling pressure. The idea is that when trading volume becomes heavily skewed toward one side of the market, sentiment may be reaching an extreme that can lead to a reversal or mean-reversion move.
The script calculates buying pressure as the volume occurring on bars that close higher than the previous bar, and selling pressure as the volume occurring on bars that close lower. These values are smoothed and converted into an Up/Down Volume Ratio. That ratio is then normalized over a configurable historical range (default: three years) to produce a **0–100 sentiment oscillator**.
This normalization allows traders to quickly see when the current level of buying or selling pressure is historically extreme.
**Strategy logic**
• Long positions open when the sentiment oscillator drops below a configurable oversold threshold (default: 10).
• Short positions open when the oscillator rises above a configurable overbought threshold (default: 90).
These thresholds represent situations where participation becomes heavily one-sided.
**Risk management**
Risk is defined as a percentage distance from the entry price (default: 5%).
Profit targets are expressed in **R multiples**, where:
• 1R = the distance from entry to stop loss
• 2R = twice the stop distance
• 3R = three times the stop distance
Using R-based exits allows traders to experiment with different reward-to-risk profiles and analyze how exit logic affects the system's expectancy.
**Configurable inputs**
• Up/Down volume smoothing length
• Normalization lookback period
• Long entry threshold
• Short entry threshold
• Stop-loss percentage
• Profit target (R multiple)
**Use cases**
This strategy can be used as a research tool to study how extreme participation levels influence price behavior. It may be applied across stocks, indexes, and other liquid markets to evaluate mean-reversion tendencies driven by volume imbalance.
As with any systematic model, traders should test across multiple markets and timeframes to understand its strengths and limitations.
Skrip sumber terbuka
Dalam semangat TradingView sebenar, pencipta skrip ini telah menjadikannya sumber terbuka, jadi pedagang boleh menilai dan mengesahkan kefungsiannya. Terima kasih kepada penulis! Walaupuan anda boleh menggunakan secara percuma, ingat bahawa penerbitan semula kod ini tertakluk kepada Peraturan Dalaman.

Penafian
Maklumat dan penerbitan adalah tidak bertujuan, dan tidak membentuk, nasihat atau cadangan kewangan, pelaburan, dagangan atau jenis lain yang diberikan atau disahkan oleh TradingView. Baca lebih dalam Terma Penggunaan.
Skrip sumber terbuka
Dalam semangat TradingView sebenar, pencipta skrip ini telah menjadikannya sumber terbuka, jadi pedagang boleh menilai dan mengesahkan kefungsiannya. Terima kasih kepada penulis! Walaupuan anda boleh menggunakan secara percuma, ingat bahawa penerbitan semula kod ini tertakluk kepada Peraturan Dalaman.
Penafian
Maklumat dan penerbitan adalah tidak bertujuan, dan tidak membentuk, nasihat atau cadangan kewangan, pelaburan, dagangan atau jenis lain yang diberikan atau disahkan oleh TradingView. Baca lebih dalam Terma Penggunaan.