BISI/SIBI MTF + Quarterly Theory True Open
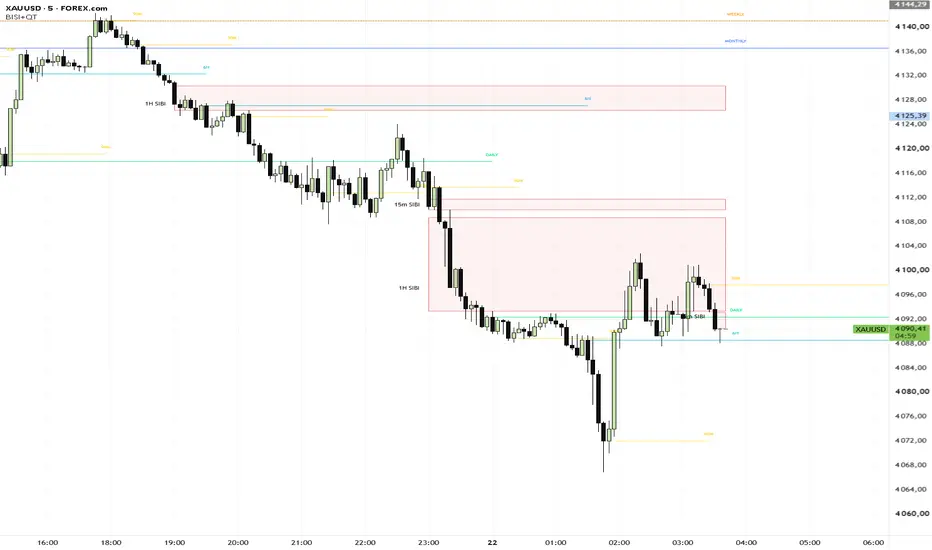
# BISI/SIBI MTF + Quarterly Theory True Open
## Overview
This indicator combines two analytical tools in one workspace: **Multi-Timeframe BISI/SIBI** and **Quarterly Theory — Period True Open**.
It is designed for traders who use price delivery, Fair Value Gaps (FVG), liquidity concepts, and time-based market structure in their analysis.
The indicator displays BISI/SIBI zones across multiple timeframes alongside True Open levels from selected Quarterly Theory cycles, helping traders analyze price imbalances and key time-based reference levels on a single chart.
## 1. Multi-Timeframe BISI/SIBI
The indicator identifies bullish and bearish Fair Value Gaps across the following timeframes:
* 1 minute
* 5 minutes
* 15 minutes
* 1 hour
* 4 hours
Each timeframe can be enabled or disabled independently.
### Main features
* **BISI** — bullish price imbalance zones.
* **SIBI** — bearish price imbalance zones.
* **Suspension Blocks (SB)** — identifies specific three-candle formations with consecutive directional candles and volume imbalances.
* **Consequent Encroachment (CE)** — the 50% midpoint of a zone.
* **25% and 75% levels** — additional internal reference levels.
* **Volume Imbalance Absorption** — optionally expands qualifying gaps to incorporate adjacent body imbalances.
* **Mitigation Tracking** — removes zones when price reaches the configured mitigation threshold.
* **Extension Modes** — extend zones to the right, update them to the current bar, or keep them fixed.
* **Overlap Filtering** — optionally hides zones overlapping higher-timeframe zones, prioritizing larger-timeframe imbalances.
Users can configure zone colors, minimum gap size, the number of active zones per timeframe, and mitigation sensitivity.
## 2. Quarterly Theory — Period True Open
The second component plots True Open reference levels for selected time-based cycles.
### Available cycles
* **Yearly**
* **Monthly**
* **Weekly**
* **Daily**
* **6H**
* **90M**
Each cycle has its own visibility toggle and color settings.
### Main features
* Configurable cycle timezone.
* Individual colors for each cycle.
* Adjustable line width and style: solid, dashed, or dotted.
* Optional labels identifying each True Open level.
* Configurable history for intraday cycles.
* Automatic termination of a previous level when a new level of the same cycle begins.
Price touching a True Open level does not, by itself, terminate that level. Its validity is based on the next opening event of the corresponding cycle.
The script uses the following calendar anchors for its cycle levels:
* Yearly: April 1, 00:00 ET.
* Monthly: the 8th day of each month, 00:00 ET.
* Weekly: Monday, 18:00 ET.
* Daily: 00:00 ET.
* 6H: 01:30, 07:30, 13:30, and 19:30 ET.
* 90M: reference levels offset by 22 minutes and 30 seconds from cycles anchored at 18:00 ET.
These are the specific cycle definitions implemented in this script.
## 3. Combined Workflow
By combining both components, traders can examine:
* How lower-timeframe imbalances relate to higher-timeframe zones.
* Where bullish and bearish price imbalances form around True Open levels.
* How price reacts to time-based reference levels.
* Whether multiple timeframes provide overlapping areas of interest.
* How price interacts with zones as they become mitigated.
The indicator is intended as an analytical aid. It does not automatically determine market direction, provide guaranteed entry signals, or replace independent trade management.
## Settings
**BISI/SIBI settings**
* Timeframe visibility
* Maximum active zones per timeframe
* Minimum FVG size in ticks
* Volume imbalance absorption
* Cross-timeframe overlap filtering
* Suspension Block detection
* CE and quarter-level visibility
* Zone extension and mitigation settings
* Bullish and bearish colors
**True Open settings**
* Cycle visibility
* Individual cycle colors
* Timezone
* Label visibility and size
* Line width and style
* Intraday history depth
* Maximum number of True Open levels
## Important Notes
This script is a visual analysis tool, not a standalone trading strategy. Its zones and levels should be interpreted in the context of market structure, liquidity, price delivery, and the trader's own risk-management rules.
The indicator does not guarantee that a zone or True Open level will produce a reaction.
**Recommended use:** Combine higher-timeframe context with lower-timeframe price action and use the displayed levels as areas for further analysis, not as automatic buy or sell instructions.
## Overview
This indicator combines two analytical tools in one workspace: **Multi-Timeframe BISI/SIBI** and **Quarterly Theory — Period True Open**.
It is designed for traders who use price delivery, Fair Value Gaps (FVG), liquidity concepts, and time-based market structure in their analysis.
The indicator displays BISI/SIBI zones across multiple timeframes alongside True Open levels from selected Quarterly Theory cycles, helping traders analyze price imbalances and key time-based reference levels on a single chart.
## 1. Multi-Timeframe BISI/SIBI
The indicator identifies bullish and bearish Fair Value Gaps across the following timeframes:
* 1 minute
* 5 minutes
* 15 minutes
* 1 hour
* 4 hours
Each timeframe can be enabled or disabled independently.
### Main features
* **BISI** — bullish price imbalance zones.
* **SIBI** — bearish price imbalance zones.
* **Suspension Blocks (SB)** — identifies specific three-candle formations with consecutive directional candles and volume imbalances.
* **Consequent Encroachment (CE)** — the 50% midpoint of a zone.
* **25% and 75% levels** — additional internal reference levels.
* **Volume Imbalance Absorption** — optionally expands qualifying gaps to incorporate adjacent body imbalances.
* **Mitigation Tracking** — removes zones when price reaches the configured mitigation threshold.
* **Extension Modes** — extend zones to the right, update them to the current bar, or keep them fixed.
* **Overlap Filtering** — optionally hides zones overlapping higher-timeframe zones, prioritizing larger-timeframe imbalances.
Users can configure zone colors, minimum gap size, the number of active zones per timeframe, and mitigation sensitivity.
## 2. Quarterly Theory — Period True Open
The second component plots True Open reference levels for selected time-based cycles.
### Available cycles
* **Yearly**
* **Monthly**
* **Weekly**
* **Daily**
* **6H**
* **90M**
Each cycle has its own visibility toggle and color settings.
### Main features
* Configurable cycle timezone.
* Individual colors for each cycle.
* Adjustable line width and style: solid, dashed, or dotted.
* Optional labels identifying each True Open level.
* Configurable history for intraday cycles.
* Automatic termination of a previous level when a new level of the same cycle begins.
Price touching a True Open level does not, by itself, terminate that level. Its validity is based on the next opening event of the corresponding cycle.
The script uses the following calendar anchors for its cycle levels:
* Yearly: April 1, 00:00 ET.
* Monthly: the 8th day of each month, 00:00 ET.
* Weekly: Monday, 18:00 ET.
* Daily: 00:00 ET.
* 6H: 01:30, 07:30, 13:30, and 19:30 ET.
* 90M: reference levels offset by 22 minutes and 30 seconds from cycles anchored at 18:00 ET.
These are the specific cycle definitions implemented in this script.
## 3. Combined Workflow
By combining both components, traders can examine:
* How lower-timeframe imbalances relate to higher-timeframe zones.
* Where bullish and bearish price imbalances form around True Open levels.
* How price reacts to time-based reference levels.
* Whether multiple timeframes provide overlapping areas of interest.
* How price interacts with zones as they become mitigated.
The indicator is intended as an analytical aid. It does not automatically determine market direction, provide guaranteed entry signals, or replace independent trade management.
## Settings
**BISI/SIBI settings**
* Timeframe visibility
* Maximum active zones per timeframe
* Minimum FVG size in ticks
* Volume imbalance absorption
* Cross-timeframe overlap filtering
* Suspension Block detection
* CE and quarter-level visibility
* Zone extension and mitigation settings
* Bullish and bearish colors
**True Open settings**
* Cycle visibility
* Individual cycle colors
* Timezone
* Label visibility and size
* Line width and style
* Intraday history depth
* Maximum number of True Open levels
## Important Notes
This script is a visual analysis tool, not a standalone trading strategy. Its zones and levels should be interpreted in the context of market structure, liquidity, price delivery, and the trader's own risk-management rules.
The indicator does not guarantee that a zone or True Open level will produce a reaction.
**Recommended use:** Combine higher-timeframe context with lower-timeframe price action and use the displayed levels as areas for further analysis, not as automatic buy or sell instructions.

Penafian
Maklumat dan penerbitan adalah tidak bertujuan, dan tidak membentuk, nasihat atau cadangan kewangan, pelaburan, dagangan atau jenis lain yang diberikan atau disahkan oleh TradingView. Baca lebih dalam Terma Penggunaan.
Penafian
Maklumat dan penerbitan adalah tidak bertujuan, dan tidak membentuk, nasihat atau cadangan kewangan, pelaburan, dagangan atau jenis lain yang diberikan atau disahkan oleh TradingView. Baca lebih dalam Terma Penggunaan.