BB vs EMA 9 Gap Signals
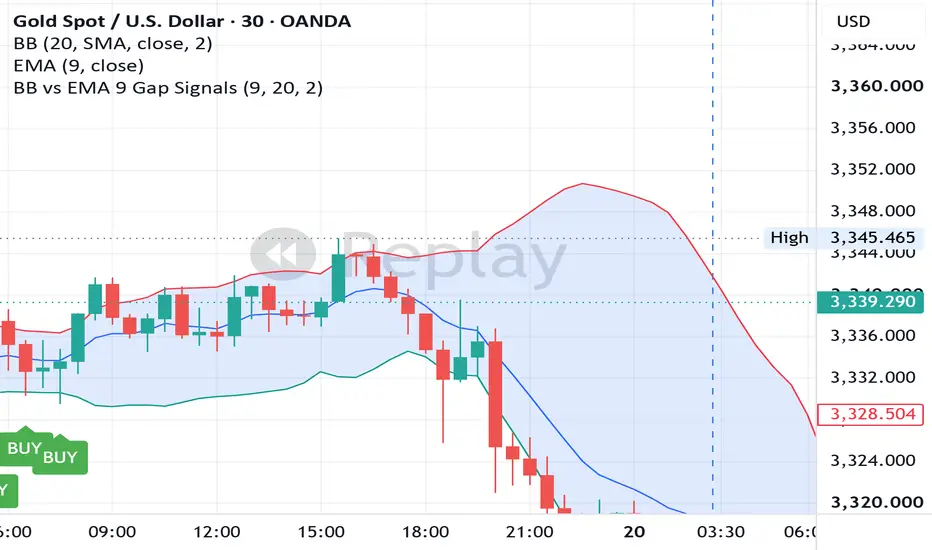
### Bollinger Band EMA Gap Signal
This indicator identifies potential **BUY and SELL opportunities** by comparing the distance between the **9-period EMA** and the upper/lower Bollinger Bands.
#### How It Works
The indicator calculates two distances:
* **X** = Upper Bollinger Band − 9 EMA
* **Y** = 9 EMA − Lower Bollinger Band
### 🟢 BUY Signal
A BUY signal is generated when:
1. **Y > X**, meaning the Lower Bollinger Band is farther from the 9 EMA than the Upper Bollinger Band.
2. Price **touches or crosses the Lower Bollinger Band**.
This identifies situations where downside volatility has expanded significantly relative to upside volatility.
### 🔴 SELL Signal
A SELL signal is generated when:
1. **X > Y**, meaning the Upper Bollinger Band is farther from the 9 EMA than the Lower Bollinger Band.
2. Price **touches or crosses the Upper Bollinger Band**.
This identifies situations where upside volatility has expanded significantly relative to downside volatility.
### Key Features
* Uses a **9-period EMA**.
* Uses standard **20-period Bollinger Bands with 2 standard deviations** by default.
* Requires price to touch or cross the relevant Bollinger Band.
* Generates BUY and SELL signals immediately when the conditions are satisfied.
* Includes alert conditions for TradingView alerts.
**Note:** The signals are based on technical conditions and should not be considered guaranteed entry or exit points. Always combine the indicator with proper risk management and market context.
This indicator identifies potential **BUY and SELL opportunities** by comparing the distance between the **9-period EMA** and the upper/lower Bollinger Bands.
#### How It Works
The indicator calculates two distances:
* **X** = Upper Bollinger Band − 9 EMA
* **Y** = 9 EMA − Lower Bollinger Band
### 🟢 BUY Signal
A BUY signal is generated when:
1. **Y > X**, meaning the Lower Bollinger Band is farther from the 9 EMA than the Upper Bollinger Band.
2. Price **touches or crosses the Lower Bollinger Band**.
This identifies situations where downside volatility has expanded significantly relative to upside volatility.
### 🔴 SELL Signal
A SELL signal is generated when:
1. **X > Y**, meaning the Upper Bollinger Band is farther from the 9 EMA than the Lower Bollinger Band.
2. Price **touches or crosses the Upper Bollinger Band**.
This identifies situations where upside volatility has expanded significantly relative to downside volatility.
### Key Features
* Uses a **9-period EMA**.
* Uses standard **20-period Bollinger Bands with 2 standard deviations** by default.
* Requires price to touch or cross the relevant Bollinger Band.
* Generates BUY and SELL signals immediately when the conditions are satisfied.
* Includes alert conditions for TradingView alerts.
**Note:** The signals are based on technical conditions and should not be considered guaranteed entry or exit points. Always combine the indicator with proper risk management and market context.

Penafian
Maklumat dan penerbitan adalah tidak bertujuan, dan tidak membentuk, nasihat atau cadangan kewangan, pelaburan, dagangan atau jenis lain yang diberikan atau disahkan oleh TradingView. Baca lebih dalam Terma Penggunaan.
Penafian
Maklumat dan penerbitan adalah tidak bertujuan, dan tidak membentuk, nasihat atau cadangan kewangan, pelaburan, dagangan atau jenis lain yang diberikan atau disahkan oleh TradingView. Baca lebih dalam Terma Penggunaan.