Telah dikemas kini
HTF Bias Dashboard EV LABS
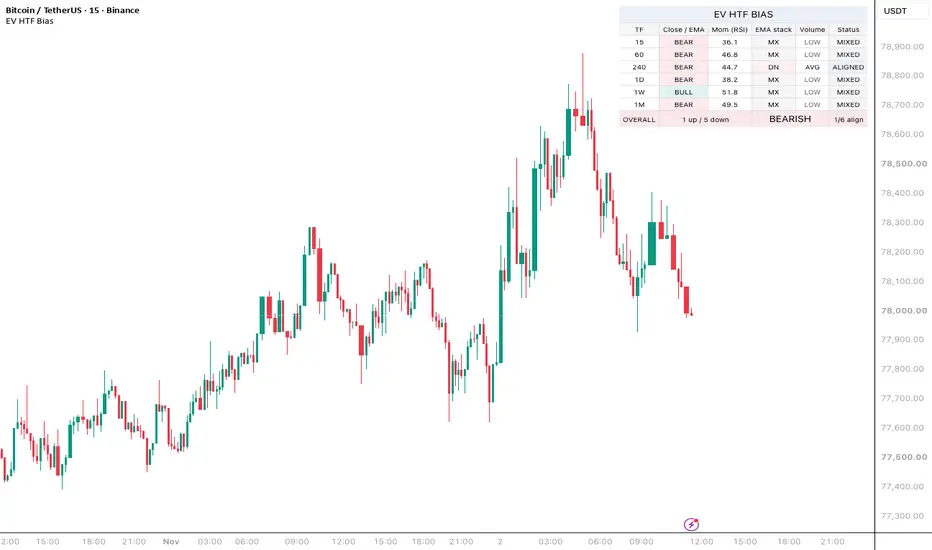
EV HTF Bias Dashboard — Multi-timeframe bias in one view
A clean, configurable dashboard that shows trend, momentum, structure, volume and alignment status across 6 timeframes at once, plus a consolidated overall bias. Drop it on any chart and you have the full multi-timeframe picture without opening 6 separate indicators.
==================================================
WHAT IT DOES
EV HTF Bias Dashboard pulls 6 configurable timeframes, computes 5 metrics per timeframe in real time, and lays them out in a single table you can position anywhere on the chart. At the bottom of the table, an OVERALL row shows you the consensus: how many timeframes are bullish, how many are bearish, and whether everything is aligned or there is conflict.
Designed for traders who want the multi-timeframe context at a glance instead of flipping through 6 charts.
==================================================
THE 5 METRICS PER TIMEFRAME
1. TREND
Based on close vs the fast EMA.
- BULL : close above the fast EMA
- BEAR : close below the fast EMA
- FLAT : equal (rare)
2. MOMENTUM (RSI)
RSI value with color coding.
- White : neutral zone
- Green : oversold (potential bounce)
- Red : overbought (potential pullback)
3. STRUCTURE
Based on the alignment of price against 3 EMAs (fast / mid / slow).
- UP : close > fast EMA > mid EMA > slow EMA (full bullish stack)
- DN : close < fast EMA < mid EMA < slow EMA (full bearish stack)
- MX : mixed alignment (transition or chop)
4. VOLUME
Current volume relative to its moving average.
- SPIKE : above your spike threshold (default 2x MA)
- HIGH : above 1.5x MA
- AVG : between 0.7x and 1.5x MA
- LOW : below 0.7x MA
5. STATUS
Combined verdict for that timeframe.
- ALIGN : trend and structure agree, RSI not extreme
- CONFL : trend and structure disagree
- RANGE : one of them is flat, no clear direction
- REVERS : trend up but RSI overbought, or trend down but RSI oversold (potential reversal warning)
==================================================
THE OVERALL ROW
A summary cell that aggregates all 6 timeframes:
- Bull vs Bear count (e.g. 4B/2B)
- Overall bias label: BULLISH, BEARISH, or MIXED
- Aligned count: how many of the 6 TFs have all 5 metrics in agreement (ALIGN status)
When the OVERALL row is BULLISH AND aligned count is 5/6 or 6/6, you have maximum confluence. That is when your other EV Labs tools (Order Blocks, FVGs, Liquidity Sweeps) become highest-probability setups.
==================================================
KEY INPUTS
Timeframes (6 rows, smallest to largest):
- Default: 15m, 1H, 4H, 1D, 1W, 1M
- Editable to anything Pine supports
Metric Settings:
- EMA Fast : default 20 (drives Trend)
- EMA Mid : default 50 (part of Structure)
- EMA Slow : default 200 (part of Structure)
- RSI Length: default 14
- Volume MA : default 20
- Volume Spike threshold: default 2.0x MA
Visuals:
- Show Dashboard: on/off
- Position: 6 options (corners + top/bottom center)
- Cell Size: Tiny / Small / Normal / Large
- Show Overall Bias Row: on/off
==================================================
ALERTS
Five built-in alert conditions, ready to use as soon as you add the indicator:
- All TFs Bullish (6/6 bullish): maximum long confluence
- All TFs Bearish (6/6 bearish): maximum short confluence
- Majority Bullish (5+/6 bullish): strong long bias
- Majority Bearish (5+/6 bearish): strong short bias
- Overall Bias Shifted: fires when the OVERALL row changes state
==================================================
RECOMMENDED SETUPS
Scalper on 1m chart
- TF1: 1, TF2: 5, TF3: 15, TF4: 60, TF5: 240, TF6: 1D
- All thresholds at default
Day trader on 15m chart
- TF1: 15, TF2: 60, TF3: 240, TF4: 1D, TF5: 1W, TF6: 1M
- All thresholds at default
Swing trader on 4H chart
- TF1: 240, TF2: 1D, TF3: 1W, TF4: 1M, TF5: 3M, TF6: 6M
- EMA Slow to 100 if you want more sensitivity on higher TFs
Position trader on D1
- TF1: 1D, TF2: 1W, TF3: 1M, TF4: 3M, TF5: 6M, TF6: 12M
- Raise Min Samples style logic via slower EMAs (50/100/200)
==================================================
HOW IT CONNECTS TO THE EV SUITE
This dashboard is the context layer. Pair it with the rest of EV Labs:
- EV Probability Engine : only take signals when the OVERALL row agrees with the trade direction
- EV Fair Value Gaps : high-probability entries when an FVG appears inside a TF marked ALIGN in your bias
- EV Order Blocks : OB taps are strongest in TFs where structure matches trend
- EV Liquidity Sweeps : sweep signals are highest quality in TFs where STATUS is ALIGN
- EV Smart Volume : cross-check the spike markers with the VOLUME column in the dashboard
==================================================
LIMITATIONS
- The "structure" column uses EMA alignment as a proxy for HH/HL market structure, not the full ICT HH/HL pivot logic. It is a robust shortcut, not a literal replacement for proper swing detection.
- request.security() calls are limited by Pine's platform limits. Six timeframes with 2 calls each is well within budget, but adding more would push the boundary.
- The OVERALL bias is a simple majority vote (4 of 6). It does not weight higher timeframes more than lower ones, even though in practice a 1W signal usually matters more than a 15m signal.
- Not a signal service. It is a context and confirmation tool.
==================================================
Built by EV Labs · Pine Script v6 · Open source
A clean, configurable dashboard that shows trend, momentum, structure, volume and alignment status across 6 timeframes at once, plus a consolidated overall bias. Drop it on any chart and you have the full multi-timeframe picture without opening 6 separate indicators.
==================================================
WHAT IT DOES
EV HTF Bias Dashboard pulls 6 configurable timeframes, computes 5 metrics per timeframe in real time, and lays them out in a single table you can position anywhere on the chart. At the bottom of the table, an OVERALL row shows you the consensus: how many timeframes are bullish, how many are bearish, and whether everything is aligned or there is conflict.
Designed for traders who want the multi-timeframe context at a glance instead of flipping through 6 charts.
==================================================
THE 5 METRICS PER TIMEFRAME
1. TREND
Based on close vs the fast EMA.
- BULL : close above the fast EMA
- BEAR : close below the fast EMA
- FLAT : equal (rare)
2. MOMENTUM (RSI)
RSI value with color coding.
- White : neutral zone
- Green : oversold (potential bounce)
- Red : overbought (potential pullback)
3. STRUCTURE
Based on the alignment of price against 3 EMAs (fast / mid / slow).
- UP : close > fast EMA > mid EMA > slow EMA (full bullish stack)
- DN : close < fast EMA < mid EMA < slow EMA (full bearish stack)
- MX : mixed alignment (transition or chop)
4. VOLUME
Current volume relative to its moving average.
- SPIKE : above your spike threshold (default 2x MA)
- HIGH : above 1.5x MA
- AVG : between 0.7x and 1.5x MA
- LOW : below 0.7x MA
5. STATUS
Combined verdict for that timeframe.
- ALIGN : trend and structure agree, RSI not extreme
- CONFL : trend and structure disagree
- RANGE : one of them is flat, no clear direction
- REVERS : trend up but RSI overbought, or trend down but RSI oversold (potential reversal warning)
==================================================
THE OVERALL ROW
A summary cell that aggregates all 6 timeframes:
- Bull vs Bear count (e.g. 4B/2B)
- Overall bias label: BULLISH, BEARISH, or MIXED
- Aligned count: how many of the 6 TFs have all 5 metrics in agreement (ALIGN status)
When the OVERALL row is BULLISH AND aligned count is 5/6 or 6/6, you have maximum confluence. That is when your other EV Labs tools (Order Blocks, FVGs, Liquidity Sweeps) become highest-probability setups.
==================================================
KEY INPUTS
Timeframes (6 rows, smallest to largest):
- Default: 15m, 1H, 4H, 1D, 1W, 1M
- Editable to anything Pine supports
Metric Settings:
- EMA Fast : default 20 (drives Trend)
- EMA Mid : default 50 (part of Structure)
- EMA Slow : default 200 (part of Structure)
- RSI Length: default 14
- Volume MA : default 20
- Volume Spike threshold: default 2.0x MA
Visuals:
- Show Dashboard: on/off
- Position: 6 options (corners + top/bottom center)
- Cell Size: Tiny / Small / Normal / Large
- Show Overall Bias Row: on/off
==================================================
ALERTS
Five built-in alert conditions, ready to use as soon as you add the indicator:
- All TFs Bullish (6/6 bullish): maximum long confluence
- All TFs Bearish (6/6 bearish): maximum short confluence
- Majority Bullish (5+/6 bullish): strong long bias
- Majority Bearish (5+/6 bearish): strong short bias
- Overall Bias Shifted: fires when the OVERALL row changes state
==================================================
RECOMMENDED SETUPS
Scalper on 1m chart
- TF1: 1, TF2: 5, TF3: 15, TF4: 60, TF5: 240, TF6: 1D
- All thresholds at default
Day trader on 15m chart
- TF1: 15, TF2: 60, TF3: 240, TF4: 1D, TF5: 1W, TF6: 1M
- All thresholds at default
Swing trader on 4H chart
- TF1: 240, TF2: 1D, TF3: 1W, TF4: 1M, TF5: 3M, TF6: 6M
- EMA Slow to 100 if you want more sensitivity on higher TFs
Position trader on D1
- TF1: 1D, TF2: 1W, TF3: 1M, TF4: 3M, TF5: 6M, TF6: 12M
- Raise Min Samples style logic via slower EMAs (50/100/200)
==================================================
HOW IT CONNECTS TO THE EV SUITE
This dashboard is the context layer. Pair it with the rest of EV Labs:
- EV Probability Engine : only take signals when the OVERALL row agrees with the trade direction
- EV Fair Value Gaps : high-probability entries when an FVG appears inside a TF marked ALIGN in your bias
- EV Order Blocks : OB taps are strongest in TFs where structure matches trend
- EV Liquidity Sweeps : sweep signals are highest quality in TFs where STATUS is ALIGN
- EV Smart Volume : cross-check the spike markers with the VOLUME column in the dashboard
==================================================
LIMITATIONS
- The "structure" column uses EMA alignment as a proxy for HH/HL market structure, not the full ICT HH/HL pivot logic. It is a robust shortcut, not a literal replacement for proper swing detection.
- request.security() calls are limited by Pine's platform limits. Six timeframes with 2 calls each is well within budget, but adding more would push the boundary.
- The OVERALL bias is a simple majority vote (4 of 6). It does not weight higher timeframes more than lower ones, even though in practice a 1W signal usually matters more than a 15m signal.
- Not a signal service. It is a context and confirmation tool.
==================================================
Built by EV Labs · Pine Script v6 · Open source
Nota Keluaran
HTF BIAS DASHBOARD — SIX TIMEFRAMES, SEPARATE CONTEXT MEASURESHTF Bias Dashboard compares the chart market across six selected source intervals. Each row shows close-versus-EMA direction, RSI, EMA-stack order, relative volume and a descriptive status. An optional overall row summarizes the direction votes.
The overall reading is a count of closes above or below the fast EMA. It is not a combined score of every displayed metric, an entry signal or a measured success probability.
01 / CONFIGURE THE SIX SOURCE INTERVALS
Initial intervals are 15 minutes, 60 minutes, 240 minutes, daily, weekly and monthly. All rows use the current chart symbol; this is a multi-timeframe dashboard rather than a multi-symbol watchlist.
Rows appear in the order entered. Smallest to largest is a useful reading order, but the script does not sort or validate that ordering. Duplicate timeframe inputs count as separate equal-weight rows in the overall vote, so use distinct intervals if you intend six distinct observations.
Metric settings are shared across rows. Initial lengths are EMA 20, EMA 50, EMA 200, RSI 14 and a 20-bar volume average. Lengths refer to each row's source bars, not an equal number of clock hours. Long-interval averages need adequate source history for a meaningful interpretation.
02 / WHAT EACH COLUMN MEASURES
- Close / EMA: BULL when the source close is strictly above its fast EMA; BEAR when strictly below; FLAT otherwise. This is the only metric that casts the overall direction vote.
- Mom (RSI): the source RSI value, displayed to one decimal. Values strictly above 70 or below 30 receive separate color accents.
- EMA stack: UP requires close > fast EMA > mid EMA > slow EMA. DN requires the full inverse ordering. MX means the full ordering is absent. This is an EMA arrangement, not pivot-based BOS/CHoCH structure.
- Volume: source volume compared with its source volume average. It is a participation descriptor and does not determine the overall direction vote.
Default volume classification checks these conditions in order: SPIKE above the configurable spike multiple, initially 2; otherwise HIGH above 1.5 times average; otherwise AVG above 0.7 times average; otherwise LOW. The inequalities are strict. Changing the spike multiple can take precedence over the fixed HIGH threshold.
The current source candle is included in the volume average. Comparing a developing weekly or monthly candle with averages of whole candles is not an elapsed-session-adjusted relative-volume measure. The refreshed display shows N/A when volume or its average is missing, rather than presenting the engine's legacy fallback as verified average participation.
03 / STATUS IS A DESCRIPTION, NOT A REVERSAL TRIGGER
The original internal rules are retained with clearer displayed names:
- MIXED, formerly RANGE: direction or full EMA stack is neutral/mixed. It does not establish that price is trading in a horizontal range.
- STRETCHED, formerly REVERS: direction and stack agree, with RSI strictly above 75 for bullish alignment or strictly below 25 for bearish alignment. No reversal candle or later turn is required.
- ALIGNED, formerly ALIGN: the full directional EMA ordering qualifies without that stretched-RSI condition.
- CONFLICT, formerly CONFL: retained for the legacy direction-versus-stack conflict branch. With the current stack formula, a nonzero stack already implies the same close-versus-fast-EMA direction, so this branch is normally unreachable.
The RSI color thresholds of 70/30 differ from the status thresholds of 75/25. An RSI-colored cell does not necessarily produce STRETCHED. Display rounding does not change any comparison.
04 / THE OVERALL VOTE
Each of the six rows contributes one up vote, one down vote or neither according to Close / EMA. At least four up votes gives BULLISH; at least four down gives BEARISH; otherwise the result is MIXED. All rows have equal weight, including monthly and 15-minute rows.
The rewritten count now says up / down instead of the ambiguous B/B abbreviation. The aligned count is the number of rows in the original ALIGN state. STRETCHED rows are not included in that count, and an ALIGNED row can be bullish or bearish. The count therefore does not mean that all counted rows agree with each other or with the overall result.
RSI, EMA-stack state, volume and aligned count do not enter the overall formula. For example, four closes can be above EMA 20 while their longer EMA stacks remain mixed. A bullish overall with few aligned rows is possible under these rules.
05 / ALERTS AND SOURCE-CANDLE TIMING
Five original alert titles and conditions are preserved: all six bullish, all six bearish, at least five bullish, at least five bearish and overall bias shifted. The first four are state conditions, so they can qualify on successive chart bars; they are not limited to the first entry into that state. When all six qualify, the corresponding five-plus condition also qualifies.
The bias-shift condition compares the overall result with its previous chart-bar state, including transitions into or out of MIXED. None of these alerts requires the EMA stack, RSI or volume to agree.
Four directional alert messages now describe the fast-EMA vote instead of instructing a long or short trade. Their titles and conditions remain unchanged; the bias-shift message is unchanged. Recreate an existing TradingView alert if you want the revised message or updated input snapshot.
The twelve source requests use current outputs with gaps_off and lookahead_off. There is no closed-source-candle offset or confirmation gate. Higher-interval readings can change while their candle develops, and closing a chart candle does not necessarily close that source candle. Historical and realtime availability can differ. Lower-than-chart intervals return sampled data rather than every intrabar.
06 / THE REFRESHED WORKSPACE
Teal and rose distinguish directional cells, blue organizes headers and alignment, and amber identifies stretched/spike context. The dashboard follows the chart theme, preserves six positions and four cell sizes, and retains the optional overall row. Missing RSI values display dashes. Hiding the table or overall row does not disable calculations or alerts.
Read the longer rows for context, then inspect shorter-row disagreement on the chart. Any entry, risk sizing, invalidation or exit rule needs its own specification and evaluation. This update changes presentation and four alert messages while preserving all requests, metric rules, vote counts, status conditions and alert qualification.

Penafian
Maklumat dan penerbitan adalah tidak bertujuan, dan tidak membentuk, nasihat atau cadangan kewangan, pelaburan, dagangan atau jenis lain yang diberikan atau disahkan oleh TradingView. Baca lebih dalam Terma Penggunaan.
Penafian
Maklumat dan penerbitan adalah tidak bertujuan, dan tidak membentuk, nasihat atau cadangan kewangan, pelaburan, dagangan atau jenis lain yang diberikan atau disahkan oleh TradingView. Baca lebih dalam Terma Penggunaan.