Telah dikemas kini
Volume breakout
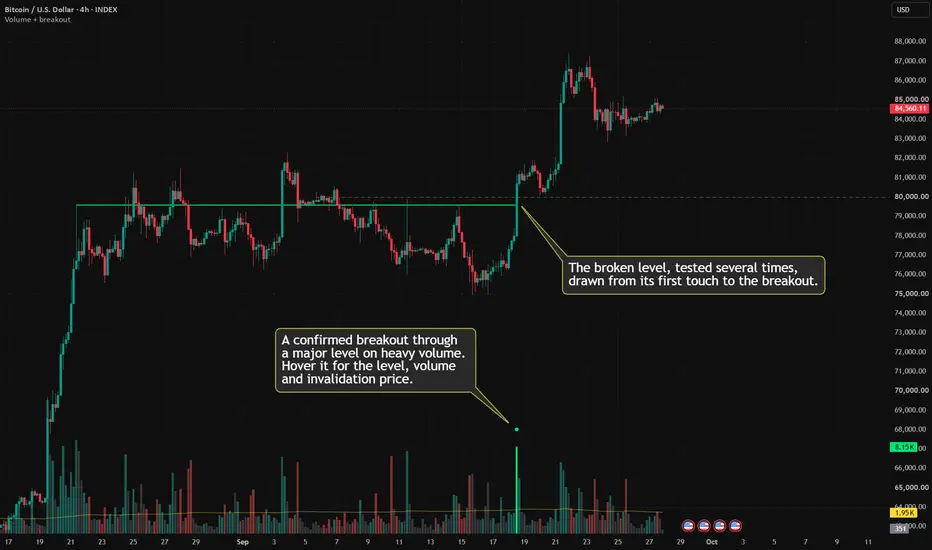
Volume breakout separates real breakouts from false ones. A move out of a range is only credible when heavy volume drives it. This indicator checks every breakout for that fuel and marks only the ones that pass. No volume, no breakout.
HOW IT WORKS
The pane shows volume columns colored with the classic HawkEye method: green is buying volume, red is selling volume, gray is neutral noise. The yellow line is the average volume.
A breakout is a close above the highest high, or below the lowest low, of the last 20 bars. The close must clear that level by a small ATR buffer, so one-tick pokes do not count. The breakout is only confirmed when all three checks agree:
- Heavy volume: at least 1.5x normal. On intraday charts, normal means the same time of day over recent sessions, so the opening bell does not fake a volume spike.
- HawkEye agrees: the bar is green for a bullish breakout, red for a bearish one.
- Strong close: the bar closes in the top 40% of its range for a bullish breakout, or the bottom 40% for a bearish one.
Two optional filters make it stricter: a maximum range width in ATR, so only breakouts from tight consolidations count, and higher-timeframe trend alignment, which does not repaint.
HOW TO USE
- Green circle: a bullish breakout backed by buyers.
- Red circle: a bearish breakdown backed by sellers.
- No circle: price broke out, but the volume did not back it. Treat it as suspect and a possible trap.
The confirmed bar's volume column is highlighted as well. A natural invalidation level is a close back inside the old range.
Three alerts are available: Confirmed bullish breakout, Confirmed bearish breakdown and Suspect breakout. They fire on the bar close only, so a live bar that reverses never triggers them.
WHEN TO USE
- Breakouts from ranges, bases and consolidations.
- Stocks, crypto and futures, on any timeframe.
- Not on symbols without real volume data, such as many forex pairs and CFDs. Without volume the indicator gives no verdict.
Volume coloring is based on the classic HawkEye Volume Indicator.
HOW IT WORKS
The pane shows volume columns colored with the classic HawkEye method: green is buying volume, red is selling volume, gray is neutral noise. The yellow line is the average volume.
A breakout is a close above the highest high, or below the lowest low, of the last 20 bars. The close must clear that level by a small ATR buffer, so one-tick pokes do not count. The breakout is only confirmed when all three checks agree:
- Heavy volume: at least 1.5x normal. On intraday charts, normal means the same time of day over recent sessions, so the opening bell does not fake a volume spike.
- HawkEye agrees: the bar is green for a bullish breakout, red for a bearish one.
- Strong close: the bar closes in the top 40% of its range for a bullish breakout, or the bottom 40% for a bearish one.
Two optional filters make it stricter: a maximum range width in ATR, so only breakouts from tight consolidations count, and higher-timeframe trend alignment, which does not repaint.
HOW TO USE
- Green circle: a bullish breakout backed by buyers.
- Red circle: a bearish breakdown backed by sellers.
- No circle: price broke out, but the volume did not back it. Treat it as suspect and a possible trap.
The confirmed bar's volume column is highlighted as well. A natural invalidation level is a close back inside the old range.
Three alerts are available: Confirmed bullish breakout, Confirmed bearish breakdown and Suspect breakout. They fire on the bar close only, so a live bar that reverses never triggers them.
WHEN TO USE
- Breakouts from ranges, bases and consolidations.
- Stocks, crypto and futures, on any timeframe.
- Not on symbols without real volume data, such as many forex pairs and CFDs. Without volume the indicator gives no verdict.
Volume coloring is based on the classic HawkEye Volume Indicator.
Nota Keluaran
Update: smarter defaults, major levels and sustained volume- Major levels: breakouts through support or resistance that price has respected for months now get a bigger dot. The level lines can be drawn on the price chart. They are off by default.
- Sustained volume: when volume builds over the bars after a breakout instead of on the breakout bar itself, the breakout can now confirm a few bars later. A box marks the volume window.
- Tuned defaults: tested on crypto, stocks and forex, on daily and 4h charts. The tight-range and weekly-trend filters are now on, and the buffer and volume thresholds are stricter. Expect fewer signals, with a much better follow-through rate.
- New alert: Confirmed major breakout.
Nota Keluaran
Update: matches the built-in Volume, dot tooltips- Same scale as the built-in Volume: the columns are sized against the tallest volume in view and reach the same height as TradingView's own Volume indicator. They adjust as you zoom or scroll.
- Bottom of the chart: the columns now start at the same point as the built-in Volume. To make them touch the very bottom edge, set the bottom margin to 0% in Settings > Canvas.
- Dot tooltips: hover over a dot to see the broken level, when it was first touched, the volume behind the breakout and the close that would invalidate it.
- Smaller dots: the breakout dots are smaller and only grow a little when you zoom in close.
Nota Keluaran
Symbols without volume data, such as many CFDs and forex pairs, no longer show a single flat line across the chart. The indicator now shows a short note in the bottom-right corner instead, explaining that without volume no breakout can be confirmed. Nothing changes on symbols that have volume.
Penafian
Maklumat dan penerbitan adalah tidak bertujuan, dan tidak membentuk, nasihat atau cadangan kewangan, pelaburan, dagangan atau jenis lain yang diberikan atau disahkan oleh TradingView. Baca lebih dalam Terma Penggunaan.
Penafian
Maklumat dan penerbitan adalah tidak bertujuan, dan tidak membentuk, nasihat atau cadangan kewangan, pelaburan, dagangan atau jenis lain yang diberikan atau disahkan oleh TradingView. Baca lebih dalam Terma Penggunaan.