OPEN-SOURCE SCRIPT
ICT Power of 3 with Multi Bar and HTF EMA Display : PO3
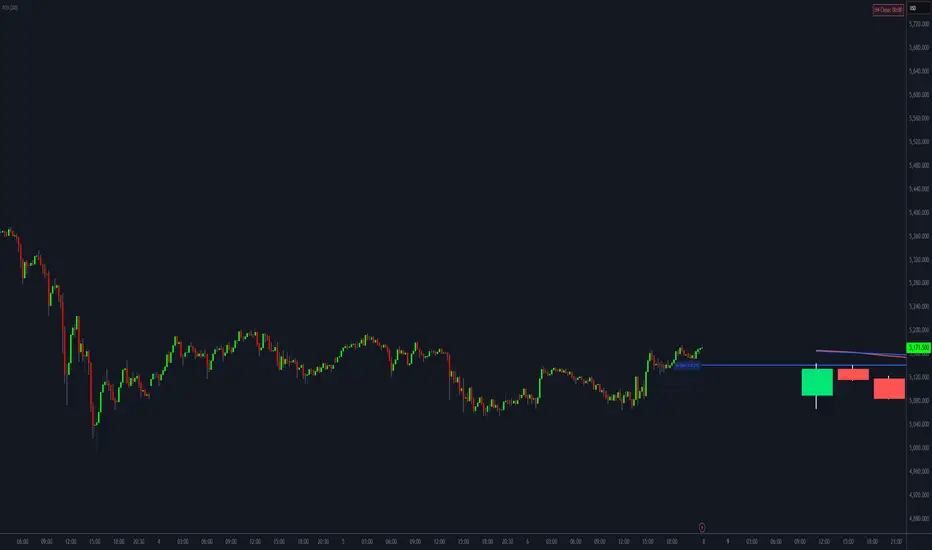
MyFXRoom HTF Bar Rejection — Higher Timeframe Overlay Indicator
This indicator plots higher timeframe candles directly onto your current chart, so you can analyse HTF price action and structure without switching between timeframes.
What it does:
Features:
HTF Candle Overlay — displays up to 15 higher timeframe bars directly on your chart
Fair Value Gaps — detects and highlights FVGs on both the current timeframe and the HTF overlay, so you can see where price may draw to
HTF Opening Price Line — marks the current HTF bar's opening price with a horizontal line for quick reference
Liquidity Grabs & Failed Breaks — automatically identifies when price grabs a high or low and fails to close beyond it, marking potential reversal points
Dual EMA (25 & 50) — plots both EMAs across the HTF overlay bars so you can gauge trend direction on the higher timeframe at a glance
EMA Trend Filter — long signals only when the 25 EMA is above the 50, short signals only when below
Fully customisable — colours, line styles, candle width, and positioning all adjustable
Who it's for:
Traders who use multi-timeframe analysis and want to keep their higher timeframe context visible at all times — particularly useful for ICT-based concepts including Power of 3, Fair Value Gaps, and liquidity.
This indicator plots higher timeframe candles directly onto your current chart, so you can analyse HTF price action and structure without switching between timeframes.
What it does:
- Instead of flipping between charts, you get up to 15 candles from your chosen higher timeframe (H1, H4, Daily, Weekly or any other) displayed as a clean overlay on the right side of your chart. Each candle shows the full body and wicks, colour-coded to match bullish and bearish price action.
Features:
HTF Candle Overlay — displays up to 15 higher timeframe bars directly on your chart
Fair Value Gaps — detects and highlights FVGs on both the current timeframe and the HTF overlay, so you can see where price may draw to
HTF Opening Price Line — marks the current HTF bar's opening price with a horizontal line for quick reference
Liquidity Grabs & Failed Breaks — automatically identifies when price grabs a high or low and fails to close beyond it, marking potential reversal points
Dual EMA (25 & 50) — plots both EMAs across the HTF overlay bars so you can gauge trend direction on the higher timeframe at a glance
EMA Trend Filter — long signals only when the 25 EMA is above the 50, short signals only when below
Fully customisable — colours, line styles, candle width, and positioning all adjustable
Who it's for:
Traders who use multi-timeframe analysis and want to keep their higher timeframe context visible at all times — particularly useful for ICT-based concepts including Power of 3, Fair Value Gaps, and liquidity.
Skrip sumber terbuka
Dalam semangat TradingView sebenar, pencipta skrip ini telah menjadikannya sumber terbuka, jadi pedagang boleh menilai dan mengesahkan kefungsiannya. Terima kasih kepada penulis! Walaupuan anda boleh menggunakan secara percuma, ingat bahawa penerbitan semula kod ini tertakluk kepada Peraturan Dalaman.

Penafian
Maklumat dan penerbitan adalah tidak bertujuan, dan tidak membentuk, nasihat atau cadangan kewangan, pelaburan, dagangan atau jenis lain yang diberikan atau disahkan oleh TradingView. Baca lebih dalam Terma Penggunaan.
Skrip sumber terbuka
Dalam semangat TradingView sebenar, pencipta skrip ini telah menjadikannya sumber terbuka, jadi pedagang boleh menilai dan mengesahkan kefungsiannya. Terima kasih kepada penulis! Walaupuan anda boleh menggunakan secara percuma, ingat bahawa penerbitan semula kod ini tertakluk kepada Peraturan Dalaman.
Penafian
Maklumat dan penerbitan adalah tidak bertujuan, dan tidak membentuk, nasihat atau cadangan kewangan, pelaburan, dagangan atau jenis lain yang diberikan atau disahkan oleh TradingView. Baca lebih dalam Terma Penggunaan.