OPEN-SOURCE SCRIPT
Telah dikemas kini PCRXS Forecast Engine v1.0
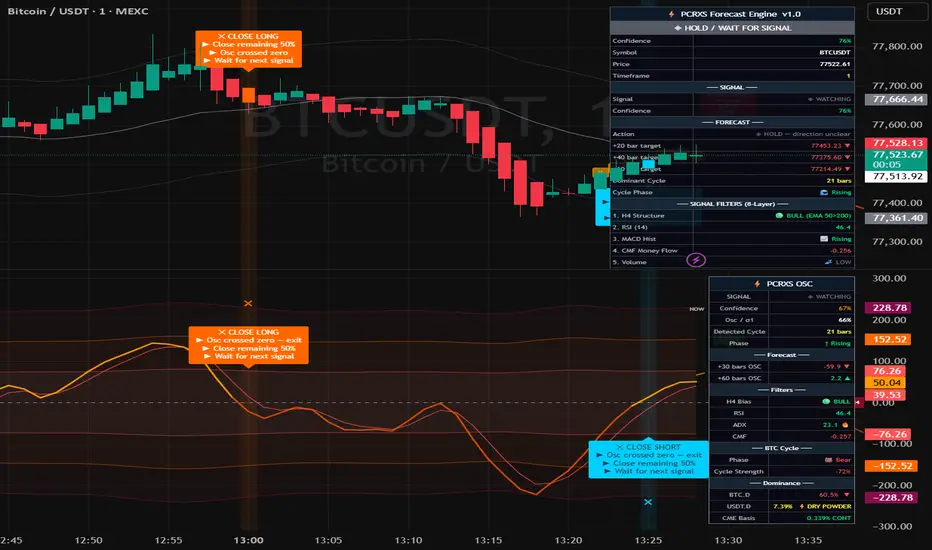
⚡ PCRXS Forecast Engine — Price Forecast
The dashed orange lines extending to the right of the current bar are a composite mathematical projection of where price is likely to go, built from 10 components that run simultaneously:
ComponentWhat it capturesLinear regression trendThe current slope and direction of the marketShort cycleDominant swing cycle auto-detected from your chart's pivot highsMedium cycle3× the short cycle — the bigger swing structureBTC halving cycle4-year model anchored to Apr 2024 halvingDXY inverseDollar strength drag/tailwind on cryptoS&P 500Risk-on/off correlation nudgeGoldSafe haven signal — rising gold dampens cryptoFear & GreedATR-based volatility proxyUSDT.D flowStablecoin capital entering or leaving cryptoCME futures basisInstitutional sentiment (contango vs backwardation)
What you see on the chart:
🟠 Dashed orange line — the composite forecast path
Dotted lines above/below — confidence bands that widen with distance (wider = less certain)
🟢 Green labels at troughs — predicted low points with date and price → where to Close Short / Buy Long
🔴 Red labels at peaks — predicted high points with date and price → where to Close Long / Buy Short
↑ ↓ labels on zero line — where the oscillator is forecast to cross zero → anticipated entry zones
The confidence % shown on each label reflects how many of the 19 market factors are pointing in the same direction. Above 70% is high conviction. Below 50% means mixed signals — treat the forecast as directional guidance only, not a guarantee.
The dashed orange lines extending to the right of the current bar are a composite mathematical projection of where price is likely to go, built from 10 components that run simultaneously:
ComponentWhat it capturesLinear regression trendThe current slope and direction of the marketShort cycleDominant swing cycle auto-detected from your chart's pivot highsMedium cycle3× the short cycle — the bigger swing structureBTC halving cycle4-year model anchored to Apr 2024 halvingDXY inverseDollar strength drag/tailwind on cryptoS&P 500Risk-on/off correlation nudgeGoldSafe haven signal — rising gold dampens cryptoFear & GreedATR-based volatility proxyUSDT.D flowStablecoin capital entering or leaving cryptoCME futures basisInstitutional sentiment (contango vs backwardation)
What you see on the chart:
🟠 Dashed orange line — the composite forecast path
Dotted lines above/below — confidence bands that widen with distance (wider = less certain)
🟢 Green labels at troughs — predicted low points with date and price → where to Close Short / Buy Long
🔴 Red labels at peaks — predicted high points with date and price → where to Close Long / Buy Short
↑ ↓ labels on zero line — where the oscillator is forecast to cross zero → anticipated entry zones
The confidence % shown on each label reflects how many of the 19 market factors are pointing in the same direction. Above 70% is high conviction. Below 50% means mixed signals — treat the forecast as directional guidance only, not a guarantee.
Nota Keluaran
Minor cosmetic fixesSkrip sumber terbuka
Dalam semangat TradingView sebenar, pencipta skrip ini telah menjadikannya sumber terbuka, jadi pedagang boleh menilai dan mengesahkan kefungsiannya. Terima kasih kepada penulis! Walaupuan anda boleh menggunakan secara percuma, ingat bahawa penerbitan semula kod ini tertakluk kepada Peraturan Dalaman.

Penafian
Maklumat dan penerbitan adalah tidak bertujuan, dan tidak membentuk, nasihat atau cadangan kewangan, pelaburan, dagangan atau jenis lain yang diberikan atau disahkan oleh TradingView. Baca lebih dalam Terma Penggunaan.
Skrip sumber terbuka
Dalam semangat TradingView sebenar, pencipta skrip ini telah menjadikannya sumber terbuka, jadi pedagang boleh menilai dan mengesahkan kefungsiannya. Terima kasih kepada penulis! Walaupuan anda boleh menggunakan secara percuma, ingat bahawa penerbitan semula kod ini tertakluk kepada Peraturan Dalaman.
Penafian
Maklumat dan penerbitan adalah tidak bertujuan, dan tidak membentuk, nasihat atau cadangan kewangan, pelaburan, dagangan atau jenis lain yang diberikan atau disahkan oleh TradingView. Baca lebih dalam Terma Penggunaan.