Premium and Discount Range Profile @MaxMaserati
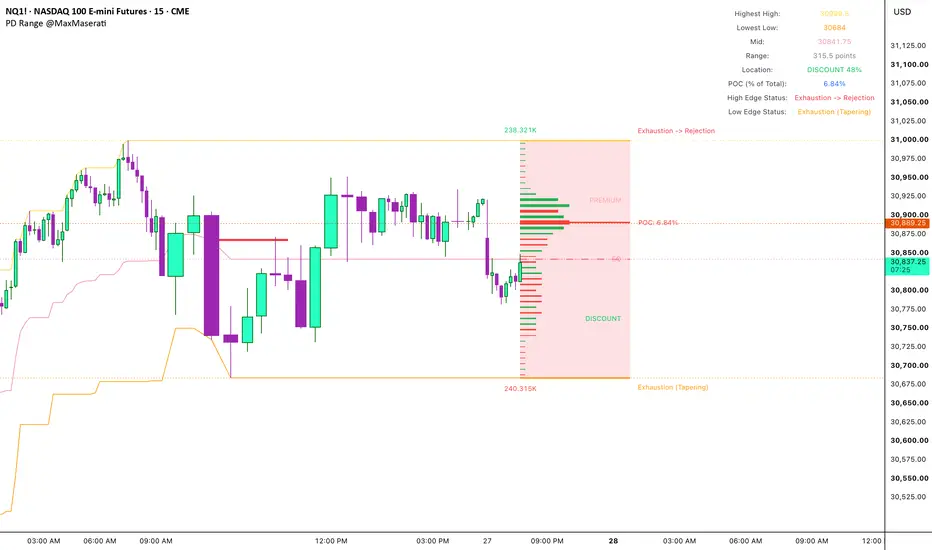
Premium and Discount Auction Range Footprint Profile
This script builds a live range from the highest high and lowest low of the last N bars, splits it at the midline into premium and discount, and profiles the volume traded inside it. It then reads the volume at each edge to show whether that edge is being rejected, accepted, or exhausted.
─── WHY THESE COMPONENTS TOGETHER ───
A high-low range shows where price is expensive or cheap, but not whether traders defend its edges.
A volume profile shows where volume traded, but not how it relates to the range edges.
Buy and sell volume shows who was aggressive, but not at which level.
Together, each edge gets an auction verdict: rejection, acceptance, or exhaustion.
─── PREMIUM AND DISCOUNT ───
Midline (EQ) = (Highest High + Lowest Low) / 2.
Location = (Close - Lowest Low) / (Highest High - Lowest Low) x 100. Above 50% = PREMIUM, below 50% = DISCOUNT.
The PREMIUM and DISCOUNT labels mark each half. The half holding price is shown at full color.
First Step: a green line prints on the first confirmed bar where the midline starts rising, a red line where it starts falling.
─── FOOTPRINT PROFILE ───
The range is split into bins. With footprint data, each row's buy and sell volume goes into its bin. Without it, volume is spread over the bins each candle touches and split using the candle body and wicks. The largest bin is the POC. Bins above 70% of the POC are HVN, below 30% are LVN.
─── EDGE STATES ───
Top bin HVN with sellers dominant = Strong Rejection. HVN with buyers dominant = Acceptance. LVN = Exhaustion, upgraded to Exhaustion -> Rejection when a seller-dominant node sits in the top 33% of the range. The bottom edge mirrors this.
─── HOW TO USE ───
1. Read the Location row and the highlighted label: PREMIUM or DISCOUNT.
2. Look for shorts in premium and longs in discount.
3. Before a short, check High Edge Status for Strong Rejection or Exhaustion -> Rejection. Before a long, check Low Edge Status.
4. A red First Step in premium supports shorts. A green First Step in discount supports longs.
5. The idea is invalid when that edge shows Acceptance, or a new high or low extends the range.
─── SETTINGS ───
Range Settings - lookback and box length.
Footprint Data - footprint toggle and row size.
Box Settings - box, midline, colors.
Premium and Discount Zones - labels and colors.
Volume Profile and Nodes - bins, width, POC, HVN, LVN.
Volume and AMT Labels - delta labels, edge states, scan depth.
Line Settings - optional high, low, mid plots.
Info Table Settings - table rows including Location.
First Step Signals - step lines and history.
─── NOTES ───
The range, profile, labels and edge states include the live candle and update until it closes. First Step lines print on confirmed bars only. Without footprint data, buy and sell volume are estimates. Built for intraday futures such as ES1! and NQ1!.
This script builds a live range from the highest high and lowest low of the last N bars, splits it at the midline into premium and discount, and profiles the volume traded inside it. It then reads the volume at each edge to show whether that edge is being rejected, accepted, or exhausted.
─── WHY THESE COMPONENTS TOGETHER ───
A high-low range shows where price is expensive or cheap, but not whether traders defend its edges.
A volume profile shows where volume traded, but not how it relates to the range edges.
Buy and sell volume shows who was aggressive, but not at which level.
Together, each edge gets an auction verdict: rejection, acceptance, or exhaustion.
─── PREMIUM AND DISCOUNT ───
Midline (EQ) = (Highest High + Lowest Low) / 2.
Location = (Close - Lowest Low) / (Highest High - Lowest Low) x 100. Above 50% = PREMIUM, below 50% = DISCOUNT.
The PREMIUM and DISCOUNT labels mark each half. The half holding price is shown at full color.
First Step: a green line prints on the first confirmed bar where the midline starts rising, a red line where it starts falling.
─── FOOTPRINT PROFILE ───
The range is split into bins. With footprint data, each row's buy and sell volume goes into its bin. Without it, volume is spread over the bins each candle touches and split using the candle body and wicks. The largest bin is the POC. Bins above 70% of the POC are HVN, below 30% are LVN.
─── EDGE STATES ───
Top bin HVN with sellers dominant = Strong Rejection. HVN with buyers dominant = Acceptance. LVN = Exhaustion, upgraded to Exhaustion -> Rejection when a seller-dominant node sits in the top 33% of the range. The bottom edge mirrors this.
─── HOW TO USE ───
1. Read the Location row and the highlighted label: PREMIUM or DISCOUNT.
2. Look for shorts in premium and longs in discount.
3. Before a short, check High Edge Status for Strong Rejection or Exhaustion -> Rejection. Before a long, check Low Edge Status.
4. A red First Step in premium supports shorts. A green First Step in discount supports longs.
5. The idea is invalid when that edge shows Acceptance, or a new high or low extends the range.
─── SETTINGS ───
Range Settings - lookback and box length.
Footprint Data - footprint toggle and row size.
Box Settings - box, midline, colors.
Premium and Discount Zones - labels and colors.
Volume Profile and Nodes - bins, width, POC, HVN, LVN.
Volume and AMT Labels - delta labels, edge states, scan depth.
Line Settings - optional high, low, mid plots.
Info Table Settings - table rows including Location.
First Step Signals - step lines and history.
─── NOTES ───
The range, profile, labels and edge states include the live candle and update until it closes. First Step lines print on confirmed bars only. Without footprint data, buy and sell volume are estimates. Built for intraday futures such as ES1! and NQ1!.

MMM : No body close (PO4), No Trade.
maxmaserati.com/
maxmaserati.com/
Penafian
Maklumat dan penerbitan adalah tidak bertujuan, dan tidak membentuk, nasihat atau cadangan kewangan, pelaburan, dagangan atau jenis lain yang diberikan atau disahkan oleh TradingView. Baca lebih dalam Terma Penggunaan.
MMM : No body close (PO4), No Trade.
maxmaserati.com/
maxmaserati.com/
Penafian
Maklumat dan penerbitan adalah tidak bertujuan, dan tidak membentuk, nasihat atau cadangan kewangan, pelaburan, dagangan atau jenis lain yang diberikan atau disahkan oleh TradingView. Baca lebih dalam Terma Penggunaan.