OPEN-SOURCE SCRIPT
Telah dikemas kini ICC Market Structure and Phase Tracking
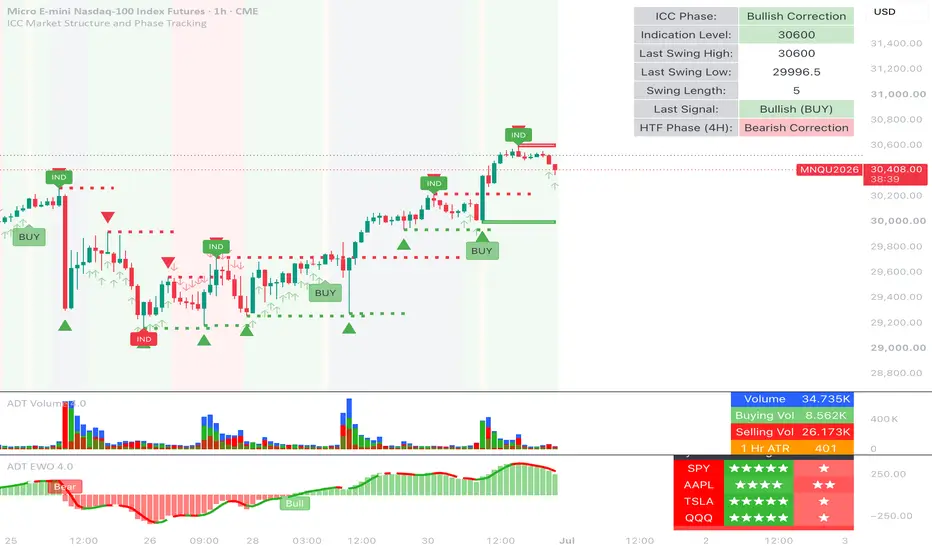
ICC Market Structure and Phase Tracker
ICC Market Structure and Phase Tracker is a visual market-structure indicator based on the Indication → Correction → Continuation (ICC) framework — a structured approach to analyzing break-of-structure, pullback, consolidation, and trend-continuation phases.
The script focuses on identifying structural phases, key levels, and phase transitions across multiple timeframes, providing clear contextual market structure information.
What the Indicator Identifies
The indicator tracks complete market-structure cycles by classifying price action into the following phases:
CORE FEATURES
Market Structure & Phase Tracking
Intended Use
This script is designed as a market-structure and contextual analysis tool.
Users are expected to apply their own analysis, validation, and risk management when interpreting the displayed structure.
Feedback
Bug reports, edge cases, and constructive feedback are welcome.
The project is actively refined with a focus on structure clarity, phase accuracy, and multi-timeframe usability.
ICC Market Structure and Phase Tracker is a visual market-structure indicator based on the Indication → Correction → Continuation (ICC) framework — a structured approach to analyzing break-of-structure, pullback, consolidation, and trend-continuation phases.
The script focuses on identifying structural phases, key levels, and phase transitions across multiple timeframes, providing clear contextual market structure information.
What the Indicator Identifies
The indicator tracks complete market-structure cycles by classifying price action into the following phases:
- Indication — initial structural break or trend initiation
- Correction — pullback, retracement, or consolidation following the break
- Continuation — expansion or impulse in the direction of structure
- Neutral / No Setup — periods without valid structural conditions
CORE FEATURES
Market Structure & Phase Tracking
- Automatic detection of structural breaks, corrections, consolidations, and continuations
- Background shading to clearly distinguish phases
- Invalidation logic to identify failed or broken structures
- Optional higher-timeframe (HTF) structure displayed on lower-timeframe charts
- HTF indication levels shown as reference lines
- HTF phase and context displayed in the information table
- Visual markers for continuation and optional reversal structures
- Clear visual separation between trend-aligned and counter-structure events
- Reversal structure visualization can be enabled or disabled in settings
- Structure-based support and resistance zones
- Optional ATR-based zone sizing that adapts to market volatility
- Configurable historical zones (0–3) with visual hierarchy
- Displays current ICC phase, indication level, consolidation status, and HTF context
- Designed for quick reference without relying solely on chart visuals
- Alerts trigger only when corresponding visual conditions appear on the chart
- Includes alerts for ICC phases, continuation structures, and optional reversals
- Auto Profiles for different trading contexts (Scalping, Intraday, Swing, Entry)
- Manual controls for swing length, consolidation behavior, and volatility settings
- Higher-timeframe controls for filtering and visual alignment
- Reversal toggle to enable or disable counter-structure visualization
Intended Use
This script is designed as a market-structure and contextual analysis tool.
Users are expected to apply their own analysis, validation, and risk management when interpreting the displayed structure.
Feedback
Bug reports, edge cases, and constructive feedback are welcome.
The project is actively refined with a focus on structure clarity, phase accuracy, and multi-timeframe usability.
Nota Keluaran
Update: On 15-minute and lower charts, the indicator now shifts from structure confirmation to entry detection. This means lower-timeframe signals are intended for entries, not full ICC structure. When price breaks the latest support or resistance, an ENTRY flag will appear. This helps identify potential trade entries when dropping down to lower timeframes to time the end of a correction aligned with a higher-timeframe bias, and when not aligned, may indicate a potential early counter-trend reversal setup, or that the higher-timeframe correction is still in progress.The final row of the table remains visible to keep the selected higher-timeframe phase in context, serving as a reminder of the broader market structure while executing on lower timeframes. Also, the table’s higher-timeframe reference now adjusts automatically: 1-hour charts reference the 4-hour timeframe, and 4-hour charts reference the Daily timeframe.
Although ICC is not a scalping-focused trading style, these lower-timeframe ENTRY signals may be effectively used by traders who favor scalping-style executions.
Nota Keluaran
Small update to address the table visibility when using dark mode; table will update depending on light/dark background colors, and you can also now change the location of the table on the chart. Nota Keluaran
Update:• Improved entry alert reliability by fixing the alert state tracking. The script now correctly recognizes the first occurrence of a new BUY/SELL signal instead of potentially treating the same ongoing signal as a new alert.
• Improved alert sequencing so duplicate suppression occurs in the correct order, resulting in more consistent alerts during live market conditions.
• Fixed alert price capture so alerts consistently report the correct trigger price at the moment the signal is generated.
• Alert Reminder:
For all entry alerts (BUY, BUY+, SELL, SELL+, BULL ENTRY, BEAR ENTRY, etc.) with dynamic signal type, price, and timestamp, create your TradingView alert using "Any alert() function call". The alert message will automatically identify which signal was triggered. If you only want BUY+/SELL+ signals (aligned with higher time frame), check the "Filter Entries by HTF Direction" in the settings.
• Lower Timeframe (15m and below):
ENTRY labels identify support/resistance breakout opportunities. If TP/SL lines also appear with an ENTRY signal, the breakout is also aligned with the full ICC continuation model for that timeframe, providing additional ICC confirmation for that setup.
• Fixed a minor issue affecting the "Last Signal" display in the information table where bearish signals were not always identified correctly.
Skrip sumber terbuka
Dalam semangat TradingView sebenar, pencipta skrip ini telah menjadikannya sumber terbuka, jadi pedagang boleh menilai dan mengesahkan kefungsiannya. Terima kasih kepada penulis! Walaupuan anda boleh menggunakan secara percuma, ingat bahawa penerbitan semula kod ini tertakluk kepada Peraturan Dalaman.

Penafian
Maklumat dan penerbitan adalah tidak bertujuan, dan tidak membentuk, nasihat atau cadangan kewangan, pelaburan, dagangan atau jenis lain yang diberikan atau disahkan oleh TradingView. Baca lebih dalam Terma Penggunaan.
Skrip sumber terbuka
Dalam semangat TradingView sebenar, pencipta skrip ini telah menjadikannya sumber terbuka, jadi pedagang boleh menilai dan mengesahkan kefungsiannya. Terima kasih kepada penulis! Walaupuan anda boleh menggunakan secara percuma, ingat bahawa penerbitan semula kod ini tertakluk kepada Peraturan Dalaman.
Penafian
Maklumat dan penerbitan adalah tidak bertujuan, dan tidak membentuk, nasihat atau cadangan kewangan, pelaburan, dagangan atau jenis lain yang diberikan atau disahkan oleh TradingView. Baca lebih dalam Terma Penggunaan.