Taught to Trade - ATR Trailing Stop with Flip Audit
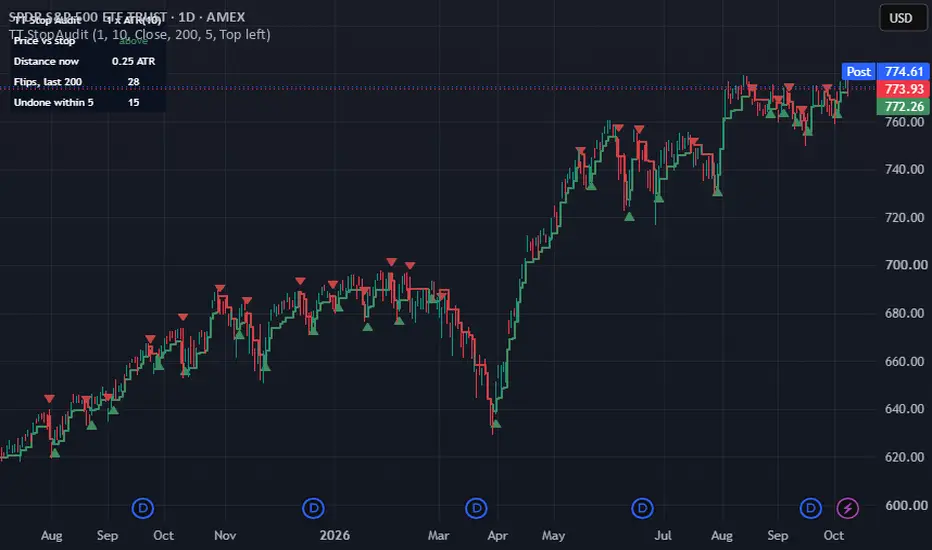
A trailing stop held a set number of ATRs from price, plus an audit of how it behaves: where the stop is, whether a flip was confirmed at the close, and how often flips were undone within a few bars. The stop rule is the one popularised by UT Bot Alerts by QuantNomad, itself built on UT Bot by Yo_adriiiiaan (who credits HPotter); credit to all three. This script is written from scratch. The audit features are what it is for.
HOW THE STOP WORKS
On each bar the distance is: Distance x ATR(ATR length).
- If price is above the previous stop on this bar and the last one, the stop can only rise: it moves up to price minus the distance, never down.
- If price is below the previous stop on both bars, the stop can only fall.
- Otherwise price has just crossed the previous stop, and the stop restarts on the other side.
A flip is the bar where price crosses the stop. Flips always alternate up and down. At Distance = 1 and ATR length = 10 on the close, this script draws the same stop and the same flip bars as UT Bot Alerts.
WHAT IT ADDS
- The stop line is drawn. UT Bot Alerts only colours bars and places labels, so you never see where the stop is.
- Distance accepts fractions (1.5, 2.25). The original input takes whole numbers only.
- Confirm flips on bar close (on by default). A flip that appears while the bar is still open is drawn as a grey circle. If price moves back before the close, the circle disappears, and you can see that a mid-bar flip was not a flip. The alerts follow the same setting.
- Heikin Ashi is computed inside the script from the chart's own bars. Its close is (open + high + low + close) / 4 of each real bar. An option measures ATR on the same Heikin Ashi candles instead of mixing the two, which the original does.
- Midpoint source: (high + low) / 2, the price Supertrend uses, so you can compare the two approaches on one chart.
- A panel shows how far price is from the stop right now in ATRs, how many flips happened in the last N bars, and how many of those were undone within a few bars. That last number is the cost of a tight setting, shown directly.
SETTINGS
- Distance (x ATR), default 1: how much give-back the stop allows. Larger means fewer flips, each one later.
- ATR length, default 10: how fast the distance reacts to a change in volatility.
- Price the stop follows: Close, Heikin Ashi close, or Midpoint.
- Confirm flips on bar close, Draw the stop line, Mark flips.
- Panel: window length, quick-reversal threshold, position.
ALERTS
Two alert conditions: price crossed above the stop, and price crossed below the stop. You create and manage your own alerts; the script does not send anything.
WHERE IT FAILS
- Every flip is late by construction: price has to give back roughly the distance from its best close before the stop is crossed.
- At tight settings an ordinary pullback flips it. Watch the "undone within" count in the panel before trusting a setting.
- It has two states and no neutral one. It is always on one side, trending or not.
- With confirmation off, a flip seen during the bar can vanish at the close.
- A setting chosen by looking at one chart was fitted to that chart. Change the symbol, the timeframe or the year and the picture changes.
- A flip records that price crossed a stop. Treating it as the start of a trend is a separate claim, and nothing in the script tests it.
Educational tool only - not investment advice. Trading involves substantial risk of loss. Past behaviour of any indicator says nothing certain about the future.
HOW THE STOP WORKS
On each bar the distance is: Distance x ATR(ATR length).
- If price is above the previous stop on this bar and the last one, the stop can only rise: it moves up to price minus the distance, never down.
- If price is below the previous stop on both bars, the stop can only fall.
- Otherwise price has just crossed the previous stop, and the stop restarts on the other side.
A flip is the bar where price crosses the stop. Flips always alternate up and down. At Distance = 1 and ATR length = 10 on the close, this script draws the same stop and the same flip bars as UT Bot Alerts.
WHAT IT ADDS
- The stop line is drawn. UT Bot Alerts only colours bars and places labels, so you never see where the stop is.
- Distance accepts fractions (1.5, 2.25). The original input takes whole numbers only.
- Confirm flips on bar close (on by default). A flip that appears while the bar is still open is drawn as a grey circle. If price moves back before the close, the circle disappears, and you can see that a mid-bar flip was not a flip. The alerts follow the same setting.
- Heikin Ashi is computed inside the script from the chart's own bars. Its close is (open + high + low + close) / 4 of each real bar. An option measures ATR on the same Heikin Ashi candles instead of mixing the two, which the original does.
- Midpoint source: (high + low) / 2, the price Supertrend uses, so you can compare the two approaches on one chart.
- A panel shows how far price is from the stop right now in ATRs, how many flips happened in the last N bars, and how many of those were undone within a few bars. That last number is the cost of a tight setting, shown directly.
SETTINGS
- Distance (x ATR), default 1: how much give-back the stop allows. Larger means fewer flips, each one later.
- ATR length, default 10: how fast the distance reacts to a change in volatility.
- Price the stop follows: Close, Heikin Ashi close, or Midpoint.
- Confirm flips on bar close, Draw the stop line, Mark flips.
- Panel: window length, quick-reversal threshold, position.
ALERTS
Two alert conditions: price crossed above the stop, and price crossed below the stop. You create and manage your own alerts; the script does not send anything.
WHERE IT FAILS
- Every flip is late by construction: price has to give back roughly the distance from its best close before the stop is crossed.
- At tight settings an ordinary pullback flips it. Watch the "undone within" count in the panel before trusting a setting.
- It has two states and no neutral one. It is always on one side, trending or not.
- With confirmation off, a flip seen during the bar can vanish at the close.
- A setting chosen by looking at one chart was fitted to that chart. Change the symbol, the timeframe or the year and the picture changes.
- A flip records that price crossed a stop. Treating it as the start of a trend is a separate claim, and nothing in the script tests it.
Educational tool only - not investment advice. Trading involves substantial risk of loss. Past behaviour of any indicator says nothing certain about the future.

Free Pine Script teardowns, a repaint checker and honest tools: taughttotrade.com (educational only, not financial advice)
Penafian
Maklumat dan penerbitan adalah tidak bertujuan, dan tidak membentuk, nasihat atau cadangan kewangan, pelaburan, dagangan atau jenis lain yang diberikan atau disahkan oleh TradingView. Baca lebih dalam Terma Penggunaan.
Free Pine Script teardowns, a repaint checker and honest tools: taughttotrade.com (educational only, not financial advice)
Penafian
Maklumat dan penerbitan adalah tidak bertujuan, dan tidak membentuk, nasihat atau cadangan kewangan, pelaburan, dagangan atau jenis lain yang diberikan atau disahkan oleh TradingView. Baca lebih dalam Terma Penggunaan.