Unhyped Trend Ribbon
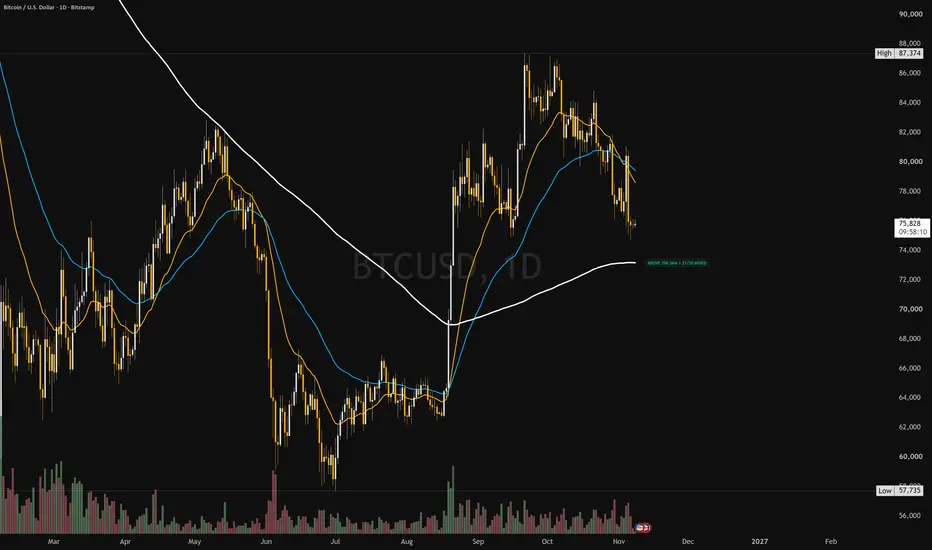
Unhyped Trend Ribbon puts the four moving averages of the Unhyped chart routine into one indicator slot, with a plain-language regime tag on the last bar.
WHAT IT PLOTS
• 21 EMA (amber): the short-term trend most pullbacks respect in a healthy move.
• 50 EMA (cyan): the medium-term trend.
• 200 SMA (white, thick): the regime line. Price above it and price below it are two different markets.
• 8 EMA (optional, faint): momentum, useful only on impulse days. Off by default to keep the chart clean.
THE REGIME TAG
On the last bar a small label reads, for example, "ABOVE 200 SMA | 21/50 ALIGNED". Aligned means the 21 EMA sits above the 50 EMA in a bull regime (below it in a bear regime). Mixed means the short and medium trend disagree, which usually calls for smaller size or more patience.
HIGHER-TIMEFRAME LOCK (NO REPAINT)
Set "Lock lines to timeframe" to, say, D on a 4H chart to see the daily averages on your intraday chart. The script reads the last confirmed higher-timeframe bar, so the lines do not repaint once a bar closes. The trade-off is that locked lines update one higher-timeframe bar later.
HOW I USE IT
The ribbon answers step 1 of my checklist, Regime: which side of the 200 SMA are we on, and do the 21 and 50 agree? It is a map, not a signal. It says nothing about where to enter or where an idea is wrong; that comes from structure, levels and a defined invalidation.
LIMITS
Moving averages lag by design. In sideways markets price chops through all four lines and the tag can flip often. Use it with levels and risk management, never alone.
Education only, not financial advice. Crypto-assets are high-risk.
WHAT IT PLOTS
• 21 EMA (amber): the short-term trend most pullbacks respect in a healthy move.
• 50 EMA (cyan): the medium-term trend.
• 200 SMA (white, thick): the regime line. Price above it and price below it are two different markets.
• 8 EMA (optional, faint): momentum, useful only on impulse days. Off by default to keep the chart clean.
THE REGIME TAG
On the last bar a small label reads, for example, "ABOVE 200 SMA | 21/50 ALIGNED". Aligned means the 21 EMA sits above the 50 EMA in a bull regime (below it in a bear regime). Mixed means the short and medium trend disagree, which usually calls for smaller size or more patience.
HIGHER-TIMEFRAME LOCK (NO REPAINT)
Set "Lock lines to timeframe" to, say, D on a 4H chart to see the daily averages on your intraday chart. The script reads the last confirmed higher-timeframe bar, so the lines do not repaint once a bar closes. The trade-off is that locked lines update one higher-timeframe bar later.
HOW I USE IT
The ribbon answers step 1 of my checklist, Regime: which side of the 200 SMA are we on, and do the 21 and 50 agree? It is a map, not a signal. It says nothing about where to enter or where an idea is wrong; that comes from structure, levels and a defined invalidation.
LIMITS
Moving averages lag by design. In sideways markets price chops through all four lines and the tag can flip often. Use it with levels and risk management, never alone.
Education only, not financial advice. Crypto-assets are high-risk.

Penafian
Maklumat dan penerbitan adalah tidak bertujuan, dan tidak membentuk, nasihat atau cadangan kewangan, pelaburan, dagangan atau jenis lain yang diberikan atau disahkan oleh TradingView. Baca lebih dalam Terma Penggunaan.
Penafian
Maklumat dan penerbitan adalah tidak bertujuan, dan tidak membentuk, nasihat atau cadangan kewangan, pelaburan, dagangan atau jenis lain yang diberikan atau disahkan oleh TradingView. Baca lebih dalam Terma Penggunaan.