OPEN-SOURCE SCRIPT
Telah dikemas kini MACD-V (Volatility-Normalised Momentum)
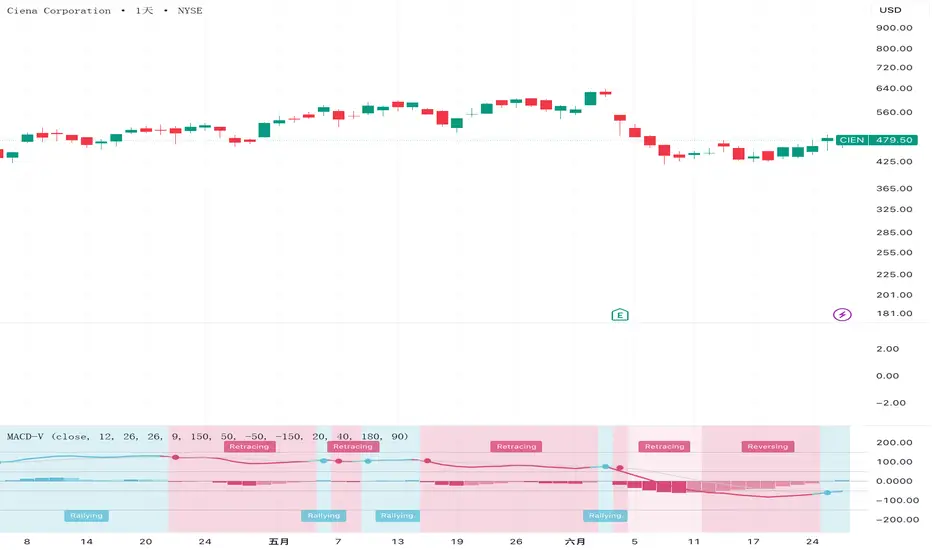
A faithful implementation of MACD-V, the volatility-normalised momentum indicator introduced by Alex Spiroglou in his Charles Dow Award–winning paper (CMT Association, 2022; SSRN 4099617).
Classic MACD has a structural flaw: because it is the raw difference of two price EMAs, its values are tied to the price scale, so the same reading means different things on different symbols and in different volatility regimes — and a level that signals "overbought" on one chart is meaningless on another. MACD-V fixes this by dividing the MACD line by ATR:
Pine Script®
Normalising by volatility makes the output comparable across instruments and across time. The same threshold levels then carry the same meaning everywhere, which is what makes a fixed "momentum lifecycle" map possible.
Momentum lifecycle
The MACD-V line is read against fixed levels rather than just its sign. Spiroglou's roadmap uses +150 / +50 / −50 / −100 / −150 to divide momentum into stages — overbought, rallying, rebounding, retracing, pullback, declining, oversold. Strong trends live above +150 (the line is unbounded, so it can reach 200+); pullbacks in an uptrend often hold near −100. The histogram (MACD-V minus its signal line) has its own ±40 extremes on a separate, smaller scale.
What this implementation adds (all optional)
Notes
The default thresholds are Spiroglou's published levels, which are meaningful precisely because the series is ATR-normalised. The Source input defaults to close but accepts any series. This is a momentum/context tool, not a trade signal and not financial advice.
Credit: the MACD-V concept and its lifecycle levels are the work of Alex Spiroglou, DipTA(STA), CFTe. This script is an independent implementation of the published formula and roadmap.
Classic MACD has a structural flaw: because it is the raw difference of two price EMAs, its values are tied to the price scale, so the same reading means different things on different symbols and in different volatility regimes — and a level that signals "overbought" on one chart is meaningless on another. MACD-V fixes this by dividing the MACD line by ATR:
Normalising by volatility makes the output comparable across instruments and across time. The same threshold levels then carry the same meaning everywhere, which is what makes a fixed "momentum lifecycle" map possible.
Momentum lifecycle
The MACD-V line is read against fixed levels rather than just its sign. Spiroglou's roadmap uses +150 / +50 / −50 / −100 / −150 to divide momentum into stages — overbought, rallying, rebounding, retracing, pullback, declining, oversold. Strong trends live above +150 (the line is unbounded, so it can reach 200+); pullbacks in an uptrend often hold near −100. The histogram (MACD-V minus its signal line) has its own ±40 extremes on a separate, smaller scale.
What this implementation adds (all optional)
- A label is printed whenever the line moves into a new lifecycle stage, so the transitions are visible without reading levels off the axis.
- Optional background shading collapses the seven stages into three momentum bands using the study's neutral zone — up above +50, ranging within ±50, down below −50 — so a label can read "Rebounding" while the background stays neutral.
- A four-colour histogram coloured by both sign and slope, so a fading move is visible before it flips sign.
- Dots at MACD-V / signal-line crosses.
- The two threshold ranges (the line's ±150/±50 and the histogram's ±40) are split into separate, independently toggled groups, and every level is an input so you can adjust them.
Notes
The default thresholds are Spiroglou's published levels, which are meaningful precisely because the series is ATR-normalised. The Source input defaults to close but accepts any series. This is a momentum/context tool, not a trade signal and not financial advice.
Credit: the MACD-V concept and its lifecycle levels are the work of Alex Spiroglou, DipTA(STA), CFTe. This script is an independent implementation of the published formula and roadmap.
Nota Keluaran
Alex Spiroglou's MACD-V (CMT Charles Dow Award 2022; SSRN 4099617) — a volatility-normalised MACD:MACD-V = (EMA12 - EMA26) / ATR26 × 100
Plain MACD is unbounded and not comparable across symbols or over time, because it grows with absolute price. Dividing the MACD spread by ATR expresses momentum in volatility units, so the same threshold levels mean the same thing on any instrument and in any era.
What's drawn:
MACD-V line (green above its signal, red below) and the signal line, with dots at their crosses.
A 4-colour histogram (MACD-V minus signal), coloured by sign and slope so a fading move shows before it flips.
Fixed threshold levels at +/-150, +/-50 and -100 (the line's lifecycle bands) and +/-40 (the histogram's own stretch extremes).
Momentum lifecycle: the thresholds split momentum into seven stages — Overbought (>+150), Rallying (+50..+150), Rebounding (0..+50), Retracing (-50..0), Pullback (-100..-50), Declining (-150..-100), Oversold (<-150). Per Spiroglou the +/-50 band (rebounding + retracing) is the "ranging" zone. Each stage is labelled, centred horizontally on that stage's run, so the label appears once the stage ends; bullish stages sit at the bottom edge, bearish at the top. The background is optionally shaded per stage by depth — fainter near zero, more opaque toward the extremes, green above / red below / gray in the ranging band.
Because MACD-V is normalised and comparable, it's well suited to systematic divergence detection — comparing swing highs/lows on the indicator against price — which is unreliable on the classic MACD. Display only — no buy/sell signals. Descriptive context, not financial advice.
Credit: MACD-V by Alex Spiroglou, DipTA (ATAA), CFTe; the underlying MACD by Gerald Appel; ATR by J. Welles Wilder.
Nota Keluaran
MACD-V — Volatility-Normalised Momentum with the Momentum Lifecycle RoadMapMACD-V is the classic MACD divided by ATR and scaled by 100:
MACD-V = ((12 EMA - 26 EMA) / ATR(26)) * 100
Plain MACD is unbounded, so the same reading means different things on different symbols and in different volatility regimes. Dividing by ATR expresses momentum in volatility units, so a reading of 100 means the same thing on any instrument and in any era. The fixed levels at +/-150 and +/-50 become universal reference points. This normalisation, and the lifecycle framework below, are the work of Alex Spiroglou (winner of the 2022 CMT Charles H. Dow Award and the NAAIM Founders Award).
What makes this version different
Most MACD-V scripts label the momentum stage purely by the height band of the line, which produces a problem: the words sound directional (Rallying, Retracing, Rebounding), but a single band is wide, so one label ends up stretched across both a rise and a fall. This script follows Spiroglou's Momentum Lifecycle RoadMap faithfully: a stage is defined by the height band AND by whether the line is above or below its signal line. The same band therefore reads differently on the way up versus the way down, so a stage no longer mixes both directions.
The seven stages
Above +150: Overbought (Risk).
+50 to +150, above the signal line: Rallying (the up-leg).
+50 to +150, below the signal line: Retracing (the down-leg).
-50 to +50: Ranging.
-150 to -50, above the signal line: Rebounding (the up-leg).
-150 to -50, below the signal line: Reversing (the down-leg).
Below -150: Oversold (Risk).
Rebounding, Rallying and Overbought form the up-leg of the cycle (shown green); Retracing, Reversing and Oversold form the down-leg (red); Ranging is the neutral transition.
Strict Ranging
Spiroglou defines a ranging market as the line staying inside +/-50 for a sustained stretch, not merely touching it. So the inner zone is only labelled Ranging once the line has stayed inside +/-50 for N consecutive bars (default 20). During the lead-in the previous leg's label is held, which keeps brief dips through +/-50 from being mislabelled as ranging. Set N to 1 if you prefer the zone to read Ranging the moment the line enters it.
On the chart
A label is printed each time the stage changes, centred on the run of that stage: up-leg labels at the bottom, down-leg at the top, Ranging on the zero line. The optional background is tinted by leg and by depth, fainter near zero and stronger toward the +/-150 extremes. The histogram (MACD-V minus its signal) is coloured by both sign and slope, with its own +/-40 extreme lines on a separate, smaller scale. Optional dots mark MACD-V / signal crossovers on the signal line.
Inputs let you change the EMA and ATR lengths, the signal length, every level and colour, the Ranging confirmation bars, and toggle the histogram, crossover dots, range lines, stage labels and background independently.
Notes
This indicator is descriptive context, not a trading signal. Spiroglou himself does not use MACD-V for signal generation; it is a framework for reading the state of momentum. Nothing here is financial advice. Based on the research of Alex Spiroglou, DipTA (ATAA), CFTe, MSTA, "MACD-V: Volatility Normalised Momentum" (2022).
Skrip sumber terbuka
Dalam semangat TradingView sebenar, pencipta skrip ini telah menjadikannya sumber terbuka, jadi pedagang boleh menilai dan mengesahkan kefungsiannya. Terima kasih kepada penulis! Walaupuan anda boleh menggunakan secara percuma, ingat bahawa penerbitan semula kod ini tertakluk kepada Peraturan Dalaman.

Penafian
Maklumat dan penerbitan adalah tidak bertujuan, dan tidak membentuk, nasihat atau cadangan kewangan, pelaburan, dagangan atau jenis lain yang diberikan atau disahkan oleh TradingView. Baca lebih dalam Terma Penggunaan.
Skrip sumber terbuka
Dalam semangat TradingView sebenar, pencipta skrip ini telah menjadikannya sumber terbuka, jadi pedagang boleh menilai dan mengesahkan kefungsiannya. Terima kasih kepada penulis! Walaupuan anda boleh menggunakan secara percuma, ingat bahawa penerbitan semula kod ini tertakluk kepada Peraturan Dalaman.
Penafian
Maklumat dan penerbitan adalah tidak bertujuan, dan tidak membentuk, nasihat atau cadangan kewangan, pelaburan, dagangan atau jenis lain yang diberikan atau disahkan oleh TradingView. Baca lebih dalam Terma Penggunaan.