OPEN-SOURCE SCRIPT
Support & Resistance [CandleChasers]
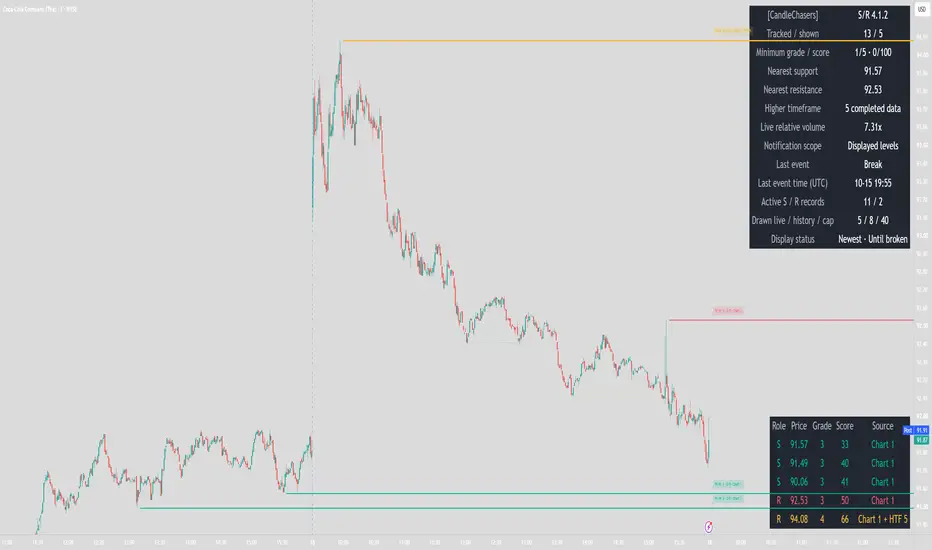
Support & Resistance [CandleChasers]
A selective support and resistance indicator built to keep meaningful price levels visible without covering the chart in horizontal lines. It combines confirmed swing detection, minimum reaction and spacing rules, evidence-based grading, higher-timeframe confluence, and configurable price-event alerts.
HOW LEVELS ARE IDENTIFIED
Support begins with a confirmed swing low; resistance begins with a confirmed swing high. Each side has its own left-side lookback, while a shared right-side confirmation window determines when the swing becomes known.
A candidate must also show a minimum close-based move away, measured in the pivot candle's ATR. Nearby qualifying candidates are grouped into an existing same-role level instead of creating another line. The representative price stays fixed when additional evidence is added.
The defaults use 50 left bars, 3 confirmation bars, a 0.75 ATR minimum reaction, and 0.50 current-chart ATR spacing. These are starting values, not universally optimized settings. The combination of confirmation, reaction qualification, and spacing is intended to reduce minor or closely overlapping levels.
READING THE LINES
• Solid: an unbroken level, or a retained unbroken level that reached its configured bar limit.
• Dotted: a level that was broken and retained in history.
• Teal by default: chart-timeframe support.
• Red by default: chart-timeframe resistance.
• Gold and slightly thicker by default: a level containing higher-timeframe evidence. Its source label identifies the role and timeframe.
Until broken is the default extension mode. Alternatively, choose Until broken or bar limit to stop a level when its maximum age is reached. Close and Wick modes are available; both confirm the decision when the chart candle closes. Equality at the threshold is a touch, not a break.
An optional tick or ATR buffer can require price to move beyond the raw level before a break is confirmed. Each buffer freezes at level creation. The line and its price label remain at the original level price.
SELECTIVE DISPLAY AND HISTORY
The default view shows up to three supports below price and three resistances above price. Newest is the default selection priority; Nearest and Strongest are also available. Selected active lines receive drawing space first. Recent completed history uses the remaining space, subject to separate broken/expired display limits.
Tracking and display are separate. A hidden active level can still be tracked. At tracking capacity, the oldest created record is retired to admit a new distinct level; retirement is not classified as a break. Completed history is also bounded, with older records removed first. Until broken disables age expiry, not these capacity or display rules.
STRENGTH GRADE: 1–5
The original strength grade summarizes qualifying swing evidence:
• Base grade: 1.
• Reaction: +1 at a qualifying reaction of at least 1 ATR, or +2 at 2 ATR or more.
• Additional qualifying swing evidence: up to +2.
Select the minimum grade you want to see. For example, 3 shows grades 3–5. Higher-timeframe discoveries can contribute evidence to a nearby chart level.
EVIDENCE SCORE: 0–100
A separate score provides more detail. It combines a base value with capped contributions for qualifying reaction size, additional swing evidence, higher-timeframe source/confluence, source pivot relative volume, and observed price rejections. Repeated visits and age apply penalties. Minimum score filtering is independent of the 1–5 grade.
The score uses: 10 base; up to 30 reaction points; 20 swing-evidence points; 15 source/confluence points; 10 volume points; and 15 rejection points, minus up to 15 repeated-visit points and 10 age points. The total is clamped to 0–100. Completed records retain their evidence and age at completion.
Neither grade nor score is a probability that a level will hold. Hover strength labels for supporting measurements, or use the Detailed dashboard to compare displayed levels.
HIGHER-TIMEFRAME LEVELS
An optional source, daily by default, detects confirmed swings using completed higher-timeframe data. Select a timeframe above the chart timeframe. Source labels distinguish chart-only, HTF-only, and shared Chart + HTF evidence. Nearby source discoveries can share one fixed representative line.
HTF levels share the same display and qualification rules as other levels; enabling the source does not guarantee a visible gold line. Adequate source history and swing confirmation are required. Higher-timeframe detection does not classify an entire market phase or guarantee stronger reactions.
ALERTS AND VOLUME FILTERS
Ten named conditions cover support/resistance breaks, role-reversal retests, touches, rejections, and approaches. Approach distance can use ticks or chart ATR. Contact tolerance, distinct-visit separation, and per-level event cooldowns are configurable.
Choose Displayed levels or All qualifying levels for notification scope. Displayed-level scope uses a selection calculated from the previous close before the current candle's events are processed, with currently available scoring and spacing values. It can differ from the live selection during that candle. Minimum grade and score apply to notification eligibility. Retest eligibility is captured at the qualifying break.
Independent optional relative-volume filters can qualify new pivot evidence, touch/rejection notifications, and break/retest notifications. They default off. Enabled filters fail when usable volume is unavailable. Notification filtering never keeps a physically broken line active: the level still stops and becomes dotted even if its break alert is suppressed. Approach notifications are distance-based and are not volume-filtered.
Create the desired alerts in TradingView and select Once Per Bar Close. Retest alerts require the retest setting to be enabled. Recreate saved alerts after changing the code or inputs.
DASHBOARDS AND LABELS
Choose Compact or Detailed layout and Small, Medium, Large, or Hidden size. The dashboard separates tracked records from visible lines and shows filters, source status, relative volume, and recent event information. Detailed layout adds a displayed-level ledger with price, role, grade, score, and source.
Price/strength labels sit above their lines with adjustable spacing. Input values are hidden from the status line while remaining available in Settings → Inputs.
TIMING AND LIMITATIONS
Levels begin on their detection candle; they are not backdated to the original swing. Swing confirmation deliberately delays discovery. Break, reaction, and alert decisions commit at chart candle close. Higher-timeframe requests use completed source data.
During an open candle, live price, ATR-based spacing, relative volume, label positions, and which eligible levels are displayed can change. This is distinct from moving a stored level's price. Feed revisions, loaded chart history, and setting changes can alter recalculated results.
If only dotted history is visible, inspect active-record counts, extension mode, minimum score/grade, source confirmation, and display status. The indicator does not invent an active level when no qualifying unbroken candidate exists.
Use standard candlestick charts. Support and resistance are approximate areas of interest even when represented by single lines. They can break, fail to react, or change relevance. This is an analytical indicator, not an automated strategy, and it makes no claim of a verified win rate, profitability, or trading edge.
A selective support and resistance indicator built to keep meaningful price levels visible without covering the chart in horizontal lines. It combines confirmed swing detection, minimum reaction and spacing rules, evidence-based grading, higher-timeframe confluence, and configurable price-event alerts.
HOW LEVELS ARE IDENTIFIED
Support begins with a confirmed swing low; resistance begins with a confirmed swing high. Each side has its own left-side lookback, while a shared right-side confirmation window determines when the swing becomes known.
A candidate must also show a minimum close-based move away, measured in the pivot candle's ATR. Nearby qualifying candidates are grouped into an existing same-role level instead of creating another line. The representative price stays fixed when additional evidence is added.
The defaults use 50 left bars, 3 confirmation bars, a 0.75 ATR minimum reaction, and 0.50 current-chart ATR spacing. These are starting values, not universally optimized settings. The combination of confirmation, reaction qualification, and spacing is intended to reduce minor or closely overlapping levels.
READING THE LINES
• Solid: an unbroken level, or a retained unbroken level that reached its configured bar limit.
• Dotted: a level that was broken and retained in history.
• Teal by default: chart-timeframe support.
• Red by default: chart-timeframe resistance.
• Gold and slightly thicker by default: a level containing higher-timeframe evidence. Its source label identifies the role and timeframe.
Until broken is the default extension mode. Alternatively, choose Until broken or bar limit to stop a level when its maximum age is reached. Close and Wick modes are available; both confirm the decision when the chart candle closes. Equality at the threshold is a touch, not a break.
An optional tick or ATR buffer can require price to move beyond the raw level before a break is confirmed. Each buffer freezes at level creation. The line and its price label remain at the original level price.
SELECTIVE DISPLAY AND HISTORY
The default view shows up to three supports below price and three resistances above price. Newest is the default selection priority; Nearest and Strongest are also available. Selected active lines receive drawing space first. Recent completed history uses the remaining space, subject to separate broken/expired display limits.
Tracking and display are separate. A hidden active level can still be tracked. At tracking capacity, the oldest created record is retired to admit a new distinct level; retirement is not classified as a break. Completed history is also bounded, with older records removed first. Until broken disables age expiry, not these capacity or display rules.
STRENGTH GRADE: 1–5
The original strength grade summarizes qualifying swing evidence:
• Base grade: 1.
• Reaction: +1 at a qualifying reaction of at least 1 ATR, or +2 at 2 ATR or more.
• Additional qualifying swing evidence: up to +2.
Select the minimum grade you want to see. For example, 3 shows grades 3–5. Higher-timeframe discoveries can contribute evidence to a nearby chart level.
EVIDENCE SCORE: 0–100
A separate score provides more detail. It combines a base value with capped contributions for qualifying reaction size, additional swing evidence, higher-timeframe source/confluence, source pivot relative volume, and observed price rejections. Repeated visits and age apply penalties. Minimum score filtering is independent of the 1–5 grade.
The score uses: 10 base; up to 30 reaction points; 20 swing-evidence points; 15 source/confluence points; 10 volume points; and 15 rejection points, minus up to 15 repeated-visit points and 10 age points. The total is clamped to 0–100. Completed records retain their evidence and age at completion.
Neither grade nor score is a probability that a level will hold. Hover strength labels for supporting measurements, or use the Detailed dashboard to compare displayed levels.
HIGHER-TIMEFRAME LEVELS
An optional source, daily by default, detects confirmed swings using completed higher-timeframe data. Select a timeframe above the chart timeframe. Source labels distinguish chart-only, HTF-only, and shared Chart + HTF evidence. Nearby source discoveries can share one fixed representative line.
HTF levels share the same display and qualification rules as other levels; enabling the source does not guarantee a visible gold line. Adequate source history and swing confirmation are required. Higher-timeframe detection does not classify an entire market phase or guarantee stronger reactions.
ALERTS AND VOLUME FILTERS
Ten named conditions cover support/resistance breaks, role-reversal retests, touches, rejections, and approaches. Approach distance can use ticks or chart ATR. Contact tolerance, distinct-visit separation, and per-level event cooldowns are configurable.
Choose Displayed levels or All qualifying levels for notification scope. Displayed-level scope uses a selection calculated from the previous close before the current candle's events are processed, with currently available scoring and spacing values. It can differ from the live selection during that candle. Minimum grade and score apply to notification eligibility. Retest eligibility is captured at the qualifying break.
Independent optional relative-volume filters can qualify new pivot evidence, touch/rejection notifications, and break/retest notifications. They default off. Enabled filters fail when usable volume is unavailable. Notification filtering never keeps a physically broken line active: the level still stops and becomes dotted even if its break alert is suppressed. Approach notifications are distance-based and are not volume-filtered.
Create the desired alerts in TradingView and select Once Per Bar Close. Retest alerts require the retest setting to be enabled. Recreate saved alerts after changing the code or inputs.
DASHBOARDS AND LABELS
Choose Compact or Detailed layout and Small, Medium, Large, or Hidden size. The dashboard separates tracked records from visible lines and shows filters, source status, relative volume, and recent event information. Detailed layout adds a displayed-level ledger with price, role, grade, score, and source.
Price/strength labels sit above their lines with adjustable spacing. Input values are hidden from the status line while remaining available in Settings → Inputs.
TIMING AND LIMITATIONS
Levels begin on their detection candle; they are not backdated to the original swing. Swing confirmation deliberately delays discovery. Break, reaction, and alert decisions commit at chart candle close. Higher-timeframe requests use completed source data.
During an open candle, live price, ATR-based spacing, relative volume, label positions, and which eligible levels are displayed can change. This is distinct from moving a stored level's price. Feed revisions, loaded chart history, and setting changes can alter recalculated results.
If only dotted history is visible, inspect active-record counts, extension mode, minimum score/grade, source confirmation, and display status. The indicator does not invent an active level when no qualifying unbroken candidate exists.
Use standard candlestick charts. Support and resistance are approximate areas of interest even when represented by single lines. They can break, fail to react, or change relevance. This is an analytical indicator, not an automated strategy, and it makes no claim of a verified win rate, profitability, or trading edge.
Skrip sumber terbuka
Dalam semangat TradingView sebenar, pencipta skrip ini telah menjadikannya sumber terbuka, jadi pedagang boleh menilai dan mengesahkan kefungsiannya. Terima kasih kepada penulis! Walaupuan anda boleh menggunakan secara percuma, ingat bahawa penerbitan semula kod ini tertakluk kepada Peraturan Dalaman.

Penafian
Maklumat dan penerbitan adalah tidak bertujuan, dan tidak membentuk, nasihat atau cadangan kewangan, pelaburan, dagangan atau jenis lain yang diberikan atau disahkan oleh TradingView. Baca lebih dalam Terma Penggunaan.
Skrip sumber terbuka
Dalam semangat TradingView sebenar, pencipta skrip ini telah menjadikannya sumber terbuka, jadi pedagang boleh menilai dan mengesahkan kefungsiannya. Terima kasih kepada penulis! Walaupuan anda boleh menggunakan secara percuma, ingat bahawa penerbitan semula kod ini tertakluk kepada Peraturan Dalaman.
Penafian
Maklumat dan penerbitan adalah tidak bertujuan, dan tidak membentuk, nasihat atau cadangan kewangan, pelaburan, dagangan atau jenis lain yang diberikan atau disahkan oleh TradingView. Baca lebih dalam Terma Penggunaan.