Composite Institutional Moving Average (CIMA)
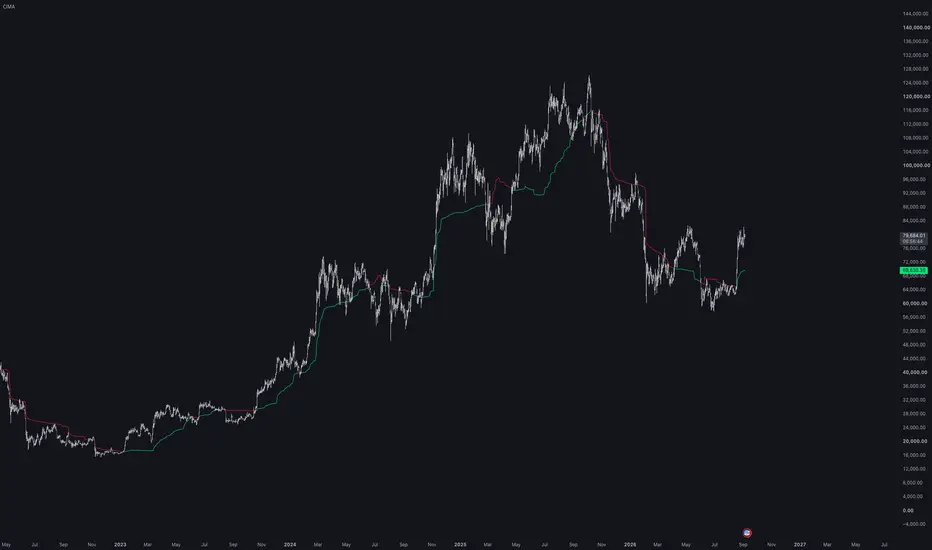
Composite Institutional Moving Average (CIMA)
Overview
The Composite Institutional Moving Average (CIMA) is a high-conviction cost-basis anchor designed to replace primitive volume-weighted indicators. Standard VWMAs treat every volume tick identically regardless of intent. CIMA evaluates the quality and composition of institutional order flow behind each bar.
By anchoring price action to a macro 126-period lookback, CIMA constructs a dynamic baseline weighted by intrabar cumulative volume delta (CVD) and stealth limit-order absorption.
Core Formula & Architecture
Rather than relying on raw volume alone, CIMA calculates a dynamic Composite Weight for every single candle using three distinct market mechanics:
$$\text{Composite Weight} = \vert{}\text{CVD Factor}\vert{} \times \text{Absorption Weight} \times \text{Volume}$$
* Order Flow Delta Proxy (cvdFactor): Measures intrabar buying versus selling pressure based on close position relative to high/low wicks. Directional imbalances pull the baseline toward true aggressive market orders.
* Stealth Absorption Efficiency (absorptionWeight): Measures total volume relative to candle range ($\text{volume} / \text{spread}$). Heavy volume printed inside narrow candle ranges highlights passive limit-order absorption (smart money accumulating or distributing without letting price move).
* 126-Period Macro Baseline Anchor: Applies the Composite Weight across a 126-period lookback using double-weighted VWMA logic ($\text{close} \times \text{compositeWeight}$). The 126-period setting represents exactly two quarters (6 months / semi-annual) of trading data on daily charts—the core timeframe used by institutional fund managers and execution algorithms to track semi-annual cost basis. On intraday charts, 126 bars provides a deep structural sample size that filters out high-frequency noise, ensuring the line only shifts when major institutional volume shelves are formed.
How to Read the Raw Baseline
Because CIMA remains un-smoothed, the indicator creates sharp vertical steps and flat horizontal shelves:
* Vertical Steps: Highlight points where sudden institutional volume injections or aggressive order sweeps occurred.
* Flat Horizontal Shelves: Function as dynamic Institutional Support & Resistance Floors. Expect smart money to defend these cost-basis shelves on the first retest.
* Trend Bias:
* Price > CIMA (Bright Green): Institutional buyers control the macro cost basis. Look for long continuation setups off CIMA shelf retests.
* Price < CIMA (Bright Red): Institutional sellers control the macro cost basis. Look for short continuation setups off CIMA shelf retests.
Key Features & Toggle Options
* Enable Volatility Bands ($\pm\sigma$): Displays optional standard deviation channels derived from the CIMA baseline to identify objective overbought/oversold value area extremes (Disabled by default for a clean chart).
* Multi-Timeframe (MTF) Engine: Toggle higher timeframe execution (e.g., Daily CIMA overlaid on a 15m chart) without code lag or repainting errors.
Default Inputs
* Institutional Lookback Length: 126 (Optimized for semi-annual structural anchoring).
* Enable Order Flow Delta Factor: True
* Enable Stealth Absorption Factor: True
* Best Applied To: Equities, Crypto, Futures, and Forex across any timeframe.
Disclaimer
This indicator is designed for educational and informational purposes only and does not constitute financial or investment advice. Past performance is no guarantee of future results. Financial market trading involves substantial risk of loss, and traders should perform their own independent technical analysis and manage their risk strictly before executing trades.
Overview
The Composite Institutional Moving Average (CIMA) is a high-conviction cost-basis anchor designed to replace primitive volume-weighted indicators. Standard VWMAs treat every volume tick identically regardless of intent. CIMA evaluates the quality and composition of institutional order flow behind each bar.
By anchoring price action to a macro 126-period lookback, CIMA constructs a dynamic baseline weighted by intrabar cumulative volume delta (CVD) and stealth limit-order absorption.
Core Formula & Architecture
Rather than relying on raw volume alone, CIMA calculates a dynamic Composite Weight for every single candle using three distinct market mechanics:
$$\text{Composite Weight} = \vert{}\text{CVD Factor}\vert{} \times \text{Absorption Weight} \times \text{Volume}$$
* Order Flow Delta Proxy (cvdFactor): Measures intrabar buying versus selling pressure based on close position relative to high/low wicks. Directional imbalances pull the baseline toward true aggressive market orders.
* Stealth Absorption Efficiency (absorptionWeight): Measures total volume relative to candle range ($\text{volume} / \text{spread}$). Heavy volume printed inside narrow candle ranges highlights passive limit-order absorption (smart money accumulating or distributing without letting price move).
* 126-Period Macro Baseline Anchor: Applies the Composite Weight across a 126-period lookback using double-weighted VWMA logic ($\text{close} \times \text{compositeWeight}$). The 126-period setting represents exactly two quarters (6 months / semi-annual) of trading data on daily charts—the core timeframe used by institutional fund managers and execution algorithms to track semi-annual cost basis. On intraday charts, 126 bars provides a deep structural sample size that filters out high-frequency noise, ensuring the line only shifts when major institutional volume shelves are formed.
How to Read the Raw Baseline
Because CIMA remains un-smoothed, the indicator creates sharp vertical steps and flat horizontal shelves:
* Vertical Steps: Highlight points where sudden institutional volume injections or aggressive order sweeps occurred.
* Flat Horizontal Shelves: Function as dynamic Institutional Support & Resistance Floors. Expect smart money to defend these cost-basis shelves on the first retest.
* Trend Bias:
* Price > CIMA (Bright Green): Institutional buyers control the macro cost basis. Look for long continuation setups off CIMA shelf retests.
* Price < CIMA (Bright Red): Institutional sellers control the macro cost basis. Look for short continuation setups off CIMA shelf retests.
Key Features & Toggle Options
* Enable Volatility Bands ($\pm\sigma$): Displays optional standard deviation channels derived from the CIMA baseline to identify objective overbought/oversold value area extremes (Disabled by default for a clean chart).
* Multi-Timeframe (MTF) Engine: Toggle higher timeframe execution (e.g., Daily CIMA overlaid on a 15m chart) without code lag or repainting errors.
Default Inputs
* Institutional Lookback Length: 126 (Optimized for semi-annual structural anchoring).
* Enable Order Flow Delta Factor: True
* Enable Stealth Absorption Factor: True
* Best Applied To: Equities, Crypto, Futures, and Forex across any timeframe.
Disclaimer
This indicator is designed for educational and informational purposes only and does not constitute financial or investment advice. Past performance is no guarantee of future results. Financial market trading involves substantial risk of loss, and traders should perform their own independent technical analysis and manage their risk strictly before executing trades.

Penafian
Maklumat dan penerbitan adalah tidak bertujuan, dan tidak membentuk, nasihat atau cadangan kewangan, pelaburan, dagangan atau jenis lain yang diberikan atau disahkan oleh TradingView. Baca lebih dalam Terma Penggunaan.
Penafian
Maklumat dan penerbitan adalah tidak bertujuan, dan tidak membentuk, nasihat atau cadangan kewangan, pelaburan, dagangan atau jenis lain yang diberikan atau disahkan oleh TradingView. Baca lebih dalam Terma Penggunaan.