EMA Cross Trend Entries [5 TP + SL + Key Levels]
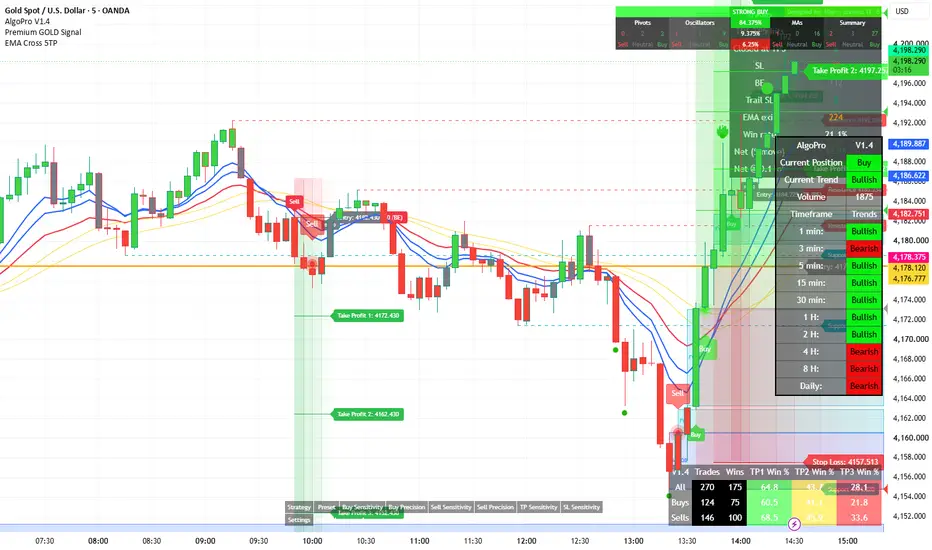
EMA Cross Trend Entries combines a filtered EMA crossover with a complete, on-chart trade plan: entry, stop loss, five take-profit levels, breakeven, and key market levels — so every signal shows exactly where you're risking and where you're targeting.
Built and tested for XAUUSD on the 5-minute chart, but fully configurable for any symbol and timeframe.
━━━━━━━━━━━━━━━━━━━━
HOW IT WORKS
━━━━━━━━━━━━━━━━━━━━
The script plots four lines:
- EMA 13 (blue) and EMA 21 (red)
- A 14-period EMA smoothing of each (yellow) — these act as a slower trend filter
BUY signal
1. EMA 13 crosses above EMA 21
2. Within the next few candles (default 3), a candle CLOSES above all four lines
3. Entry is plotted at the open of the following candle
SELL signal — the exact mirror.
Requiring a close beyond both the fast EMAs and their smoothed versions filters out many of the weak, choppy crosses a plain 2-EMA crossover produces. Each cross can only produce one trade, and only one trade is tracked at a time.
Signals are confirmed on candle close and entries are drawn on the next candle's open, so signals do not repaint.
━━━━━━━━━━━━━━━━━━━━
TRADE MANAGEMENT
━━━━━━━━━━━━━━━━━━━━
- Stop Loss — placed at the low (buy) or high (sell) of the 5th candle back, with optional buffer
- Take Profit 1–5 — fixed distances from entry (default $10 / $20 / $30 / $40 / $50), each marked with a ✓ when reached
- Breakeven — stop moves to entry once price moves a set amount in your favour (default $5)
- Optional trailing — TP1 hit → SL to breakeven, TP2 hit → SL to TP1, and so on
- Early exit — closes the trade if a candle closes back across the EMAs (choose EMA 13, EMA 13 & 21, or all 4 lines)
Every trade is drawn as a shaded risk/reward zone with right-side price tags for Entry, Stop Loss and each Take Profit, plus a label showing how the trade ended (TP, SL, BE, Trail SL or EMA Exit).
━━━━━━━━━━━━━━━━━━━━
KEY LEVELS
━━━━━━━━━━━━━━━━━━━━
- Previous Day High (PDH) and Previous Day Low (PDL)
- Automatic support and resistance from confirmed swing pivots (latest 3 each side by default)
Use these to judge whether a signal has room to reach its targets or is running straight into a level.
━━━━━━━━━━━━━━━━━━━━
STATS PANEL
━━━━━━━━━━━━━━━━━━━━
Shows how the rules performed on the loaded chart history: number of trades, hits per TP level, exits by type (SL / BE / Trail / EMA), win rate and net result in price and in account currency for a chosen lot size.
━━━━━━━━━━━━━━━━━━━━
SETTINGS
━━━━━━━━━━━━━━━━━━━━
All parameters are adjustable: EMA lengths, cross window, SL candle and buffer, number and distance of TPs, breakeven trigger, trailing, exit mode, number of past trades shown, zone colours, PDH/PDL and pivot sensitivity.
ALERTS
"EMA 13/21 BUY" and "EMA 13/21 SELL" alerts fire when a signal candle closes.
━━━━━━━━━━━━━━━━━━━━
NOTES
━━━━━━━━━━━━━━━━━━━━
- The stats are a simplified simulation on chart data: one full position per trade, no spread, commission or slippage. When a candle touches both SL and TP, the SL is assumed to hit first. Results are for evaluating the rules only.
- Pivot support/resistance is confirmed after the "right bars" setting, so new levels appear with that delay.
- This indicator is a tool for analysis and education, not financial advice. Past performance does not guarantee future results. Always test on a demo account and use proper risk management.
Built and tested for XAUUSD on the 5-minute chart, but fully configurable for any symbol and timeframe.
━━━━━━━━━━━━━━━━━━━━
HOW IT WORKS
━━━━━━━━━━━━━━━━━━━━
The script plots four lines:
- EMA 13 (blue) and EMA 21 (red)
- A 14-period EMA smoothing of each (yellow) — these act as a slower trend filter
BUY signal
1. EMA 13 crosses above EMA 21
2. Within the next few candles (default 3), a candle CLOSES above all four lines
3. Entry is plotted at the open of the following candle
SELL signal — the exact mirror.
Requiring a close beyond both the fast EMAs and their smoothed versions filters out many of the weak, choppy crosses a plain 2-EMA crossover produces. Each cross can only produce one trade, and only one trade is tracked at a time.
Signals are confirmed on candle close and entries are drawn on the next candle's open, so signals do not repaint.
━━━━━━━━━━━━━━━━━━━━
TRADE MANAGEMENT
━━━━━━━━━━━━━━━━━━━━
- Stop Loss — placed at the low (buy) or high (sell) of the 5th candle back, with optional buffer
- Take Profit 1–5 — fixed distances from entry (default $10 / $20 / $30 / $40 / $50), each marked with a ✓ when reached
- Breakeven — stop moves to entry once price moves a set amount in your favour (default $5)
- Optional trailing — TP1 hit → SL to breakeven, TP2 hit → SL to TP1, and so on
- Early exit — closes the trade if a candle closes back across the EMAs (choose EMA 13, EMA 13 & 21, or all 4 lines)
Every trade is drawn as a shaded risk/reward zone with right-side price tags for Entry, Stop Loss and each Take Profit, plus a label showing how the trade ended (TP, SL, BE, Trail SL or EMA Exit).
━━━━━━━━━━━━━━━━━━━━
KEY LEVELS
━━━━━━━━━━━━━━━━━━━━
- Previous Day High (PDH) and Previous Day Low (PDL)
- Automatic support and resistance from confirmed swing pivots (latest 3 each side by default)
Use these to judge whether a signal has room to reach its targets or is running straight into a level.
━━━━━━━━━━━━━━━━━━━━
STATS PANEL
━━━━━━━━━━━━━━━━━━━━
Shows how the rules performed on the loaded chart history: number of trades, hits per TP level, exits by type (SL / BE / Trail / EMA), win rate and net result in price and in account currency for a chosen lot size.
━━━━━━━━━━━━━━━━━━━━
SETTINGS
━━━━━━━━━━━━━━━━━━━━
All parameters are adjustable: EMA lengths, cross window, SL candle and buffer, number and distance of TPs, breakeven trigger, trailing, exit mode, number of past trades shown, zone colours, PDH/PDL and pivot sensitivity.
ALERTS
"EMA 13/21 BUY" and "EMA 13/21 SELL" alerts fire when a signal candle closes.
━━━━━━━━━━━━━━━━━━━━
NOTES
━━━━━━━━━━━━━━━━━━━━
- The stats are a simplified simulation on chart data: one full position per trade, no spread, commission or slippage. When a candle touches both SL and TP, the SL is assumed to hit first. Results are for evaluating the rules only.
- Pivot support/resistance is confirmed after the "right bars" setting, so new levels appear with that delay.
- This indicator is a tool for analysis and education, not financial advice. Past performance does not guarantee future results. Always test on a demo account and use proper risk management.

Waseem Mohammad
Penafian
Maklumat dan penerbitan adalah tidak bertujuan, dan tidak membentuk, nasihat atau cadangan kewangan, pelaburan, dagangan atau jenis lain yang diberikan atau disahkan oleh TradingView. Baca lebih dalam Terma Penggunaan.
Waseem Mohammad
Penafian
Maklumat dan penerbitan adalah tidak bertujuan, dan tidak membentuk, nasihat atau cadangan kewangan, pelaburan, dagangan atau jenis lain yang diberikan atau disahkan oleh TradingView. Baca lebih dalam Terma Penggunaan.