Telah dikemas kini
Bitcoin Halving Cycles [DotGain]
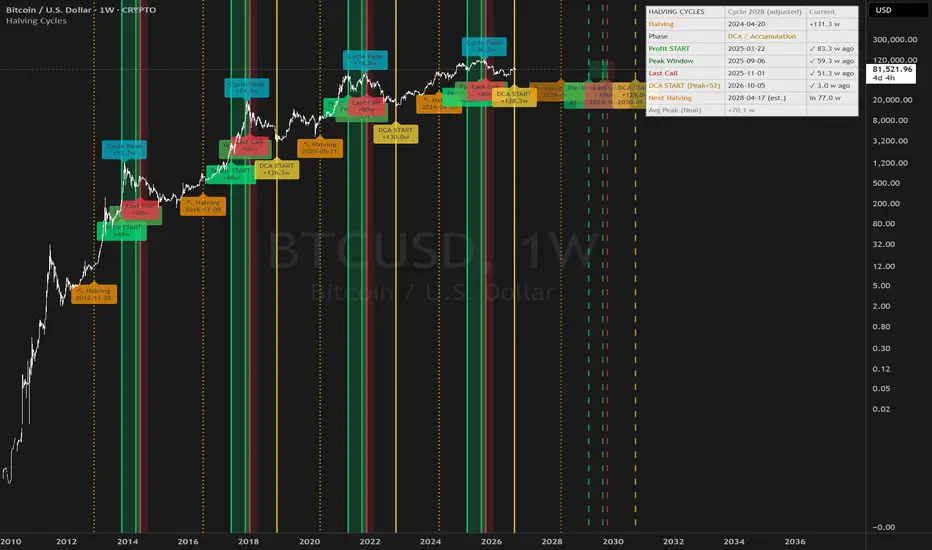
Halving Cycles
A lightweight, time-anchored Bitcoin halving cycle visualizer built for clean charting, repeatable process planning, and simple profit/DCA timing references.
This Code was heavily inspired by KevinSvenson_ who created Bitcoin Halving Cycle Profit.
What this indicator does
This script plots the key “cycle landmarks” relative to each halving date:
How to read it
HUD Panel (top-right)
The HUD gives you a fast “where are we in the cycle?” view with two modes:
Future Halvings (manual)
You can manually add up to 3 future halving dates (Halving #1–#3).
This is useful for forward planning and cycle projection even before the event happens.
Note: background zones only shade existing bars. Future projections are shown via lines/labels.
Settings overview
Have fun :)
Disclaimer
This Halving Cycles indicator is provided for informational and educational purposes only. It does not, and should not be construed as, financial, investment, or trading advice.
This indicator is an independent implementation of a time-based Bitcoin halving cycle visualization tool and is not affiliated with, or endorsed by, any third-party trading systems, strategies, protocols, or trademarked methodologies. The cycle zones, milestone markers, and countdown values displayed by this indicator are generated by a predefined set of algorithmic rules based on historical halving dates and user-defined time offsets. They do not constitute a direct recommendation to buy, sell, or hold any financial instrument or digital asset.
All trading and investing in financial markets involves a substantial risk of loss. You may lose part or all of your invested capital. Past performance does not guarantee future results. This indicator highlights historical and projected time-based market cycles and may produce false, lagging, incomplete, or misleading signals. Market behavior is influenced by many external factors and can deviate significantly from historical patterns or expectations.
The creator DotGain assumes no responsibility or liability for any financial losses, damages, or decisions made based on the use of this indicator or the information it provides. You are solely responsible for your own trading and investment decisions. Always conduct your own research (DYOR), use proper risk management, validate insights with additional tools or analysis, and consider your personal financial situation and risk tolerance before making any financial decision.
A lightweight, time-anchored Bitcoin halving cycle visualizer built for clean charting, repeatable process planning, and simple profit/DCA timing references.
This Code was heavily inspired by KevinSvenson_ who created Bitcoin Halving Cycle Profit.
What this indicator does
This script plots the key “cycle landmarks” relative to each halving date:
- Halving (⛏) – the cycle anchor
- Profit START – marks the beginning of the post-halving profit window (default: 40 weeks)
- Profit END / Last Call – marks the final phase of the profit window (default: 77 weeks)
- DCA START – marks the point where long-term accumulation becomes the focus again (default: 135 weeks)
How to read it
- Vertical lines = the exact cycle milestones
- Bottom labels = description of each milestone aligned to its line (keeps the chart clean)
- Green background (optional) = active Profit Zone on existing bars
- Red background (optional) = optional warning zone after Profit END
HUD Panel (top-right)
The HUD gives you a fast “where are we in the cycle?” view with two modes:
- Current Cycle
Shows: Halving date, Weeks since, and time remaining to Profit START / Last Call / DCA START within the current cycle. - Next Halving (Projection)
Shows: Countdown to the next enabled future halving, plus the projected weeks from today to Profit START / Last Call / DCA START after that future halving.
Future Halvings (manual)
You can manually add up to 3 future halving dates (Halving #1–#3).
This is useful for forward planning and cycle projection even before the event happens.
- Enable Halving #1 / #2 / #3
- Set Year / Month / Day for each
- Optional: show/hide future markers & projections
Note: background zones only shade existing bars. Future projections are shown via lines/labels.
Settings overview
- Show all cycles – plots every enabled cycle (historical + optional future). If disabled, only the current cycle is drawn.
- Show Profit Zone background – green shading during the active profit window (current cycle only).
- Show vertical markers + labels – toggles all milestone lines + labels.
- Show HUD – toggles the HUD panel.
- HUD Mode – switch between Current Cycle and Next Halving (Projection).
- Cycle Logic – edit offsets in weeks (Profit START / Profit END / DCA START).
- Optional Warning Zone – show a post-profit warning shading for a chosen number of weeks.
Have fun :)
Disclaimer
This Halving Cycles indicator is provided for informational and educational purposes only. It does not, and should not be construed as, financial, investment, or trading advice.
This indicator is an independent implementation of a time-based Bitcoin halving cycle visualization tool and is not affiliated with, or endorsed by, any third-party trading systems, strategies, protocols, or trademarked methodologies. The cycle zones, milestone markers, and countdown values displayed by this indicator are generated by a predefined set of algorithmic rules based on historical halving dates and user-defined time offsets. They do not constitute a direct recommendation to buy, sell, or hold any financial instrument or digital asset.
All trading and investing in financial markets involves a substantial risk of loss. You may lose part or all of your invested capital. Past performance does not guarantee future results. This indicator highlights historical and projected time-based market cycles and may produce false, lagging, incomplete, or misleading signals. Market behavior is influenced by many external factors and can deviate significantly from historical patterns or expectations.
The creator DotGain assumes no responsibility or liability for any financial losses, damages, or decisions made based on the use of this indicator or the information it provides. You are solely responsible for your own trading and investment decisions. Always conduct your own research (DYOR), use proper risk management, validate insights with additional tools or analysis, and consider your personal financial situation and risk tolerance before making any financial decision.
Nota Keluaran
Halving Cycles v2 – Update NotesNew
- Signal profiles: Cycle 2028 (adjusted) (default), Classic (40/77/135) (original values) and Custom.
- Adjusted default signals: Profit START 48w, new Peak Window 72w, Last Call 80w, DCA START 128w.
- Adaptive DCA START: set to the actual cycle peak + N weeks (default 52) once the peak is final, 104w after the halving. Can be disabled.
- Peak detection: actual cycle peaks are marked on the chart; the HUD shows the average peak week of completed cycles.
- Future projection: markers and zones (profit, peak window, warning) are drawn ahead of price.
- Halving #5 (est. 2028-04-17) enabled by default; halving dates are set with a date picker.
- Alerts: Profit START, Peak Window, Last Call, DCA START and any phase change.
- HUD: shows the current phase, dates per milestone, “✓ X w ago” for passed events and a countdown to the next halving.
- 2024 halving date corrected to 2024-04-20 (UTC); all timestamps now in UTC.
- Duplicate lines/labels no longer accumulate on realtime bars.
- Labels are now placed reliably: on the matching bar for past events, at a fixed price level for future ones.
- Markers no longer go missing on weekly charts or after data gaps.
- Halving dates are maintained in a single sorted list instead of two separate ones.
- HUD is updated on the last bar only (better performance).
- Warning zone enabled by default (12w).
- No background color from DCA START to the next halving.
- Cleaned up code and inputs; UI fully in English.

Penafian
Maklumat dan penerbitan adalah tidak bertujuan, dan tidak membentuk, nasihat atau cadangan kewangan, pelaburan, dagangan atau jenis lain yang diberikan atau disahkan oleh TradingView. Baca lebih dalam Terma Penggunaan.
Penafian
Maklumat dan penerbitan adalah tidak bertujuan, dan tidak membentuk, nasihat atau cadangan kewangan, pelaburan, dagangan atau jenis lain yang diberikan atau disahkan oleh TradingView. Baca lebih dalam Terma Penggunaan.