Kinetic Trend & Momentum Oscillator: Driver Cluster [MantisAlgo]
KINETIC TREND & MOMENTUM OSCILLATOR: 🚗DRIVER CLUSTER
Read market momentum like a driver reads the road.
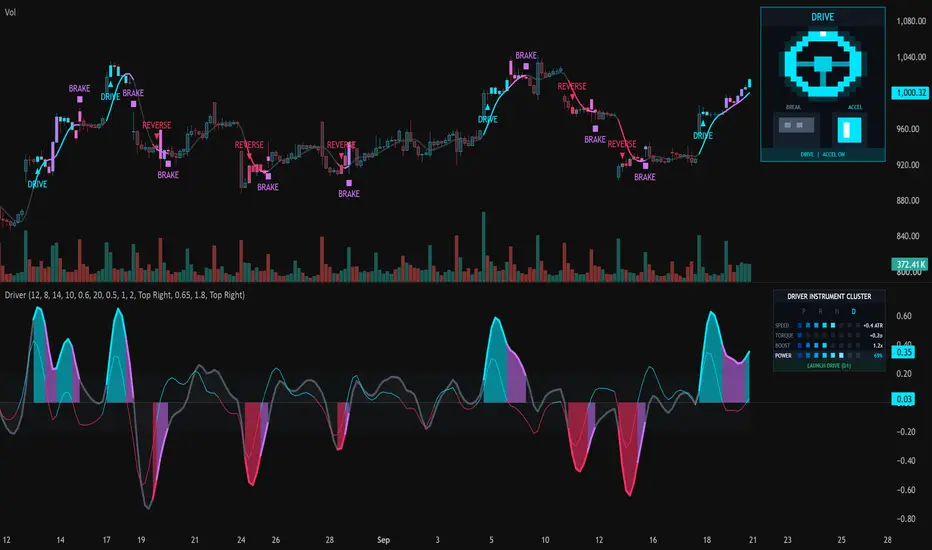
Driver Cluster brings together trend speed, changes in momentum, trading activity, and directional strength in a car-style dashboard. A steering wheel and illuminated pedals show the latest signal, while the instrument cluster helps you follow how the move develops.
The indicator uses an Ehlers SuperSmoother filter to reduce small price fluctuations before measuring movement. Think of it as smoothing out bumps in the road so the overall direction is easier to read.
🟢 THE DRIVER COCKPIT
The cockpit sits at the top right of the main price chart by default. Its name, color, and pedal position work together to show the latest accepted signal.
• DRIVE — Cyan

An upward regime has started. The steering wheel and accelerator light up, and the accelerator appears pressed.
• REVERSE — Coral

A downward regime has started. The steering wheel and accelerator turn coral, with the accelerator pressed.
• BREAK — Violet

A brake event has occurred. The accelerator is released, and the brake pedal lights up in its pressed position.
• NEUTRAL — Gray

The cockpit is waiting for its first accepted signal in the loaded chart history.
DRIVE and REVERSE remain displayed until another qualifying event changes the state. BREAK stays lit until the next DRIVE or REVERSE.
The cockpit remembers the latest signal. The lower dashboard shows current conditions, so the two displays can tell different parts of the same story.
📊 FOUR GAUGES, FOUR QUESTIONS
SPEED — How fast is the trend moving?
SPEED measures the pace and direction of the smoothed price movement.
• Above zero: upward movement.
• Below zero: downward movement.
• Near zero: little directional movement.
It is adjusted for recent volatility, making the reading more useful than a raw change in dollars or points.
TORQUE — Is the trend gaining or losing momentum?
Calculated from changes in trend speed, TORQUE helps you see whether a move is strengthening or easing.
For an upward move, positive torque means upward speed is increasing; negative torque means it is decreasing. For a downward move, negative torque can mean the decline is getting faster, while positive torque can mean it is slowing.
A useful distinction: SPEED can remain high while TORQUE weakens, just as a car can still be moving quickly after it begins to slow down.
BOOST — How active is the market?
BOOST compares reported trading volume with its recent average.
• Around 1.0x: roughly average activity.
• Above 1.0x: higher activity.
• Below 1.0x: lower activity.
POWER — How strong is the overall momentum reading?
POWER combines movement speed with TRACTION, a measure of how consistently price travels in one direction rather than zigzagging. Relative trading activity contributes to the calculation where available.
The gauge shows a percentage of the selected reference level. At 95% or higher, it displays MAX.
POWER measures intensity, not direction. Both a strong rise and a strong decline can produce a high reading.
🟢 SIGNALS & DRIVING STATES
DRIVE and REVERSE combine directional speed, torque, and traction to identify the start of a qualifying move. Trading activity provides additional confirmation where available, and a cooldown helps separate directional launches.
• DRIVE appears as a cyan triangle below the signal bar.
• REVERSE appears as a coral triangle above the signal bar.
• A brake event appears as a violet square labeled BRAKE; the cockpit displays BREAK.
A brake event occurs when an active move meets the deceleration or weakening-speed conditions. A qualifying opposite-direction signal can also switch the regime directly.
The lower dashboard follows the move through states such as LAUNCH DRIVE, STEADY CRUISE, POWER ACCEL, DECELERATING, and REVERSE DRIVE.
OVERHEAT highlights unusually high torque or POWER readings. It draws attention to momentum intensity rather than predicting a reversal.
🛣️ CHART & DASHBOARD VIEW
On the main chart:
• The steering wheel and pedals show the latest accepted signal.
• Optional candle colors reflect the current momentum phase.
• A smoothed price line helps reveal the underlying path.
• Signal markers identify directional launches and brake events.
In the lower pane:
• The main curve shows SPEED.
• The shaded ribbon emphasizes its distance from zero.
• The thin torque curve shows changes in speed on its own scale.
• Dotted boundaries at +0.20 and -0.20 mark the neutral speed band.
• The instrument cluster combines the four gauges, PRND gear selector, and driving status.
⚙️ CUSTOMIZATION
Adjust price smoothing, torque smoothing, volatility measurement, traction, and the volume lookback to suit your analysis.
Launch threshold, brake sensitivity, and cooldown settings control how the indicator responds to changing conditions.
The cockpit and lower dashboard have independent position controls. You can also adjust the cockpit proportions and show or hide chart colors, lines, signals, and the neutral band.
🔔 ALERTS & SIGNAL TIMING
Alert conditions are available for:
• Forward ignition — DRIVE.
• Reverse ignition — REVERSE.
• Brake events.
• Momentum overheat.
Chart signals can change while a candle is still open. Select Once Per Bar Close when creating an alert if you want notifications based on the closing update.
The cockpit's Change pedal state on closed bars only option is enabled by default. It makes the steering wheel and pedals wait for the candle close before accepting a new signal. This option controls the cockpit display, not the timing of all chart signals.
⚠️ DISCLAIMER
Driver Cluster is a technical-analysis and educational tool. It does not execute trades or guarantee future results. Signals describe calculated market conditions and should be evaluated alongside your own analysis and risk management.
Read market momentum like a driver reads the road.
Driver Cluster brings together trend speed, changes in momentum, trading activity, and directional strength in a car-style dashboard. A steering wheel and illuminated pedals show the latest signal, while the instrument cluster helps you follow how the move develops.
The indicator uses an Ehlers SuperSmoother filter to reduce small price fluctuations before measuring movement. Think of it as smoothing out bumps in the road so the overall direction is easier to read.
🟢 THE DRIVER COCKPIT
The cockpit sits at the top right of the main price chart by default. Its name, color, and pedal position work together to show the latest accepted signal.
• DRIVE — Cyan
An upward regime has started. The steering wheel and accelerator light up, and the accelerator appears pressed.
• REVERSE — Coral
A downward regime has started. The steering wheel and accelerator turn coral, with the accelerator pressed.
• BREAK — Violet
A brake event has occurred. The accelerator is released, and the brake pedal lights up in its pressed position.
• NEUTRAL — Gray
The cockpit is waiting for its first accepted signal in the loaded chart history.
DRIVE and REVERSE remain displayed until another qualifying event changes the state. BREAK stays lit until the next DRIVE or REVERSE.
The cockpit remembers the latest signal. The lower dashboard shows current conditions, so the two displays can tell different parts of the same story.
📊 FOUR GAUGES, FOUR QUESTIONS
SPEED — How fast is the trend moving?
SPEED measures the pace and direction of the smoothed price movement.
• Above zero: upward movement.
• Below zero: downward movement.
• Near zero: little directional movement.
It is adjusted for recent volatility, making the reading more useful than a raw change in dollars or points.
TORQUE — Is the trend gaining or losing momentum?
Calculated from changes in trend speed, TORQUE helps you see whether a move is strengthening or easing.
For an upward move, positive torque means upward speed is increasing; negative torque means it is decreasing. For a downward move, negative torque can mean the decline is getting faster, while positive torque can mean it is slowing.
A useful distinction: SPEED can remain high while TORQUE weakens, just as a car can still be moving quickly after it begins to slow down.
BOOST — How active is the market?
BOOST compares reported trading volume with its recent average.
• Around 1.0x: roughly average activity.
• Above 1.0x: higher activity.
• Below 1.0x: lower activity.
POWER — How strong is the overall momentum reading?
POWER combines movement speed with TRACTION, a measure of how consistently price travels in one direction rather than zigzagging. Relative trading activity contributes to the calculation where available.
The gauge shows a percentage of the selected reference level. At 95% or higher, it displays MAX.
POWER measures intensity, not direction. Both a strong rise and a strong decline can produce a high reading.
🟢 SIGNALS & DRIVING STATES
DRIVE and REVERSE combine directional speed, torque, and traction to identify the start of a qualifying move. Trading activity provides additional confirmation where available, and a cooldown helps separate directional launches.
• DRIVE appears as a cyan triangle below the signal bar.
• REVERSE appears as a coral triangle above the signal bar.
• A brake event appears as a violet square labeled BRAKE; the cockpit displays BREAK.
A brake event occurs when an active move meets the deceleration or weakening-speed conditions. A qualifying opposite-direction signal can also switch the regime directly.
The lower dashboard follows the move through states such as LAUNCH DRIVE, STEADY CRUISE, POWER ACCEL, DECELERATING, and REVERSE DRIVE.
OVERHEAT highlights unusually high torque or POWER readings. It draws attention to momentum intensity rather than predicting a reversal.
🛣️ CHART & DASHBOARD VIEW
On the main chart:
• The steering wheel and pedals show the latest accepted signal.
• Optional candle colors reflect the current momentum phase.
• A smoothed price line helps reveal the underlying path.
• Signal markers identify directional launches and brake events.
In the lower pane:
• The main curve shows SPEED.
• The shaded ribbon emphasizes its distance from zero.
• The thin torque curve shows changes in speed on its own scale.
• Dotted boundaries at +0.20 and -0.20 mark the neutral speed band.
• The instrument cluster combines the four gauges, PRND gear selector, and driving status.
⚙️ CUSTOMIZATION
Adjust price smoothing, torque smoothing, volatility measurement, traction, and the volume lookback to suit your analysis.
Launch threshold, brake sensitivity, and cooldown settings control how the indicator responds to changing conditions.
The cockpit and lower dashboard have independent position controls. You can also adjust the cockpit proportions and show or hide chart colors, lines, signals, and the neutral band.
🔔 ALERTS & SIGNAL TIMING
Alert conditions are available for:
• Forward ignition — DRIVE.
• Reverse ignition — REVERSE.
• Brake events.
• Momentum overheat.
Chart signals can change while a candle is still open. Select Once Per Bar Close when creating an alert if you want notifications based on the closing update.
The cockpit's Change pedal state on closed bars only option is enabled by default. It makes the steering wheel and pedals wait for the candle close before accepting a new signal. This option controls the cockpit display, not the timing of all chart signals.
⚠️ DISCLAIMER
Driver Cluster is a technical-analysis and educational tool. It does not execute trades or guarantee future results. Signals describe calculated market conditions and should be evaluated alongside your own analysis and risk management.

Penafian
Maklumat dan penerbitan adalah tidak bertujuan, dan tidak membentuk, nasihat atau cadangan kewangan, pelaburan, dagangan atau jenis lain yang diberikan atau disahkan oleh TradingView. Baca lebih dalam Terma Penggunaan.
Penafian
Maklumat dan penerbitan adalah tidak bertujuan, dan tidak membentuk, nasihat atau cadangan kewangan, pelaburan, dagangan atau jenis lain yang diberikan atau disahkan oleh TradingView. Baca lebih dalam Terma Penggunaan.