Double/Triple Tops & Bottoms [DAVIES T]
Double/Triple Tops & Bottoms [DAVIES T]
OVERVIEW
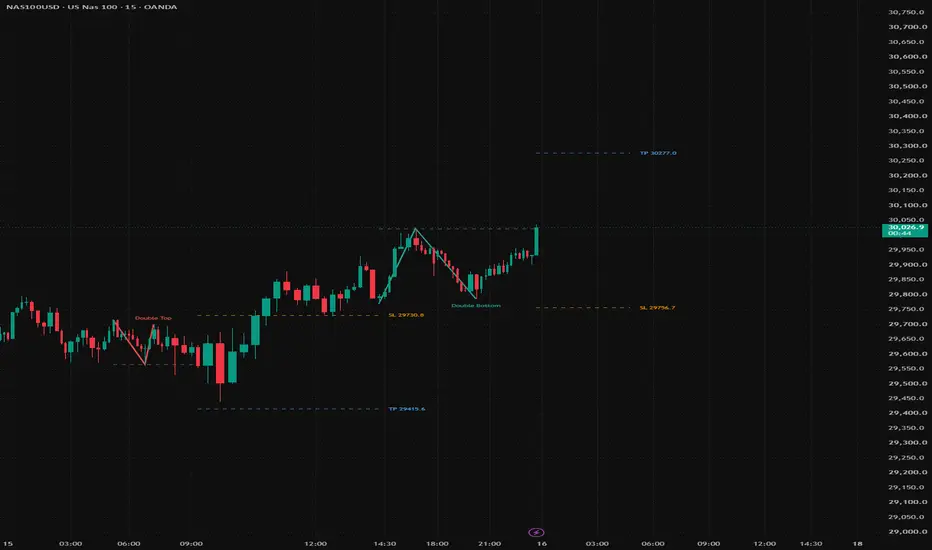
This indicator automatically detects classic Double Top, Triple Top, Double Bottom and Triple Bottom reversal patterns, tracks them while they form, and confirms them only when price closes through the neckline. On confirmation it projects a measured-move take profit and a stop loss beyond the pattern extreme.
HOW IT WORKS
1. Swing detection - Confirmed pivot highs and lows are found using a user-defined pivot strength (bars each side).
2. Peak matching - Two or three consecutive pivot highs (tops) or pivot lows (bottoms) are compared. They qualify as a pattern when they sit within an ATR-based tolerance of each other, so the logic adapts to any symbol and timeframe.
3. Neckline - The neckline is taken from the swing(s) between the peaks: the lowest intervening low for tops, the highest intervening high for bottoms. The pattern must have a minimum depth (in ATR) from peaks to neckline.
4. Clean structure check - No bar between the peaks may trade beyond the pattern extreme, which filters out broken or overlapping structures.
5. Triple priority - Triples are checked first. If a third matching peak forms on a pending double, it is upgraded to a triple automatically.
6. Forming stage - Unconfirmed patterns are drawn with a dashed zig-zag, a dotted neckline and a "DT?", "TT?", "DB?" or "TB?" label.
7. Invalidation - A pending pattern is removed if price closes beyond its extreme, or if the neckline is not broken within the allowed number of bars.
8. Confirmation - A candle close through the neckline confirms the pattern. The drawing turns solid, is labelled with its full name, and optional TP/SL lines are projected forward.
TARGETS
- TP = neckline +/- (pattern height x multiplier). The default is a 1.0x measured move.
- SL = pattern extreme +/- an ATR buffer.
SETTINGS
Detection: Pivot Strength, Peak Match Tolerance (x ATR), Min Depth to Neckline (x ATR), Min/Max Bars Between Peaks, Max Bars to Neckline Break, ATR Length.
Patterns: Toggle Double Tops, Triple Tops, Double Bottoms and Triple Bottoms individually. Optionally show forming patterns, and set how many confirmed patterns stay on the chart.
Targets: Toggle TP/SL, TP multiplier, SL ATR buffer, projection length.
Style: Bearish/bullish colours, neckline, TP and SL colours, label size.
ALERTS
- Top Forming / Top Confirmed
- Bottom Forming / Bottom Confirmed
- Any Pattern Confirmed
TUNING TIPS
- Too many patterns: lower Peak Match Tolerance (e.g. 0.3) or raise Min Depth (e.g. 1.5).
- Too few patterns on lower timeframes: lower Pivot Strength (e.g. 3).
- Higher Pivot Strength gives fewer but more significant swing-based patterns.
NOTES
- Patterns are detected on confirmed pivots, so detection is delayed by the Pivot Strength setting. Confirmations do not repaint once the candle closes.
- All drawings are time-anchored, so the indicator works on any timeframe without bar-index limits.
- Works on any market: forex, indices, crypto, stocks and futures.
DISCLAIMER
This script is for educational and analytical purposes only and is not financial advice. Chart patterns can fail; always use your own risk management.
OVERVIEW
This indicator automatically detects classic Double Top, Triple Top, Double Bottom and Triple Bottom reversal patterns, tracks them while they form, and confirms them only when price closes through the neckline. On confirmation it projects a measured-move take profit and a stop loss beyond the pattern extreme.
HOW IT WORKS
1. Swing detection - Confirmed pivot highs and lows are found using a user-defined pivot strength (bars each side).
2. Peak matching - Two or three consecutive pivot highs (tops) or pivot lows (bottoms) are compared. They qualify as a pattern when they sit within an ATR-based tolerance of each other, so the logic adapts to any symbol and timeframe.
3. Neckline - The neckline is taken from the swing(s) between the peaks: the lowest intervening low for tops, the highest intervening high for bottoms. The pattern must have a minimum depth (in ATR) from peaks to neckline.
4. Clean structure check - No bar between the peaks may trade beyond the pattern extreme, which filters out broken or overlapping structures.
5. Triple priority - Triples are checked first. If a third matching peak forms on a pending double, it is upgraded to a triple automatically.
6. Forming stage - Unconfirmed patterns are drawn with a dashed zig-zag, a dotted neckline and a "DT?", "TT?", "DB?" or "TB?" label.
7. Invalidation - A pending pattern is removed if price closes beyond its extreme, or if the neckline is not broken within the allowed number of bars.
8. Confirmation - A candle close through the neckline confirms the pattern. The drawing turns solid, is labelled with its full name, and optional TP/SL lines are projected forward.
TARGETS
- TP = neckline +/- (pattern height x multiplier). The default is a 1.0x measured move.
- SL = pattern extreme +/- an ATR buffer.
SETTINGS
Detection: Pivot Strength, Peak Match Tolerance (x ATR), Min Depth to Neckline (x ATR), Min/Max Bars Between Peaks, Max Bars to Neckline Break, ATR Length.
Patterns: Toggle Double Tops, Triple Tops, Double Bottoms and Triple Bottoms individually. Optionally show forming patterns, and set how many confirmed patterns stay on the chart.
Targets: Toggle TP/SL, TP multiplier, SL ATR buffer, projection length.
Style: Bearish/bullish colours, neckline, TP and SL colours, label size.
ALERTS
- Top Forming / Top Confirmed
- Bottom Forming / Bottom Confirmed
- Any Pattern Confirmed
TUNING TIPS
- Too many patterns: lower Peak Match Tolerance (e.g. 0.3) or raise Min Depth (e.g. 1.5).
- Too few patterns on lower timeframes: lower Pivot Strength (e.g. 3).
- Higher Pivot Strength gives fewer but more significant swing-based patterns.
NOTES
- Patterns are detected on confirmed pivots, so detection is delayed by the Pivot Strength setting. Confirmations do not repaint once the candle closes.
- All drawings are time-anchored, so the indicator works on any timeframe without bar-index limits.
- Works on any market: forex, indices, crypto, stocks and futures.
DISCLAIMER
This script is for educational and analytical purposes only and is not financial advice. Chart patterns can fail; always use your own risk management.

Penafian
Maklumat dan penerbitan adalah tidak bertujuan, dan tidak membentuk, nasihat atau cadangan kewangan, pelaburan, dagangan atau jenis lain yang diberikan atau disahkan oleh TradingView. Baca lebih dalam Terma Penggunaan.
Penafian
Maklumat dan penerbitan adalah tidak bertujuan, dan tidak membentuk, nasihat atau cadangan kewangan, pelaburan, dagangan atau jenis lain yang diberikan atau disahkan oleh TradingView. Baca lebih dalam Terma Penggunaan.