OPEN-SOURCE SCRIPT
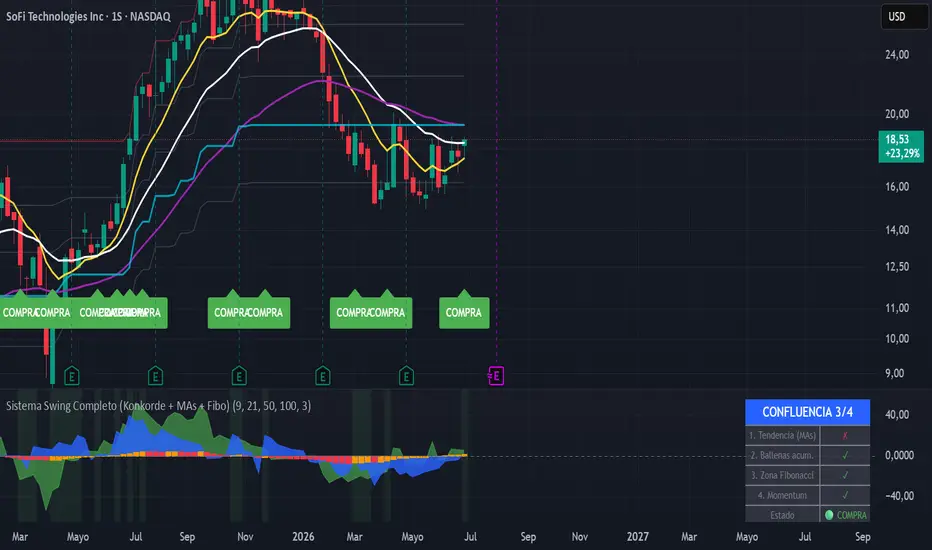
Telah dikemas kini Sistema Swing Completo (Konkorde + MAs + Fibo)
// This source code is subject to the terms of the Mozilla Public License 2.0
//version=6
indicator("Sistema Swing Completo (Konkorde + MAs + Fibo)", overlay=false)
// =====================================================================
// 1. KONCORDE (VOLUMEN DE BALLENAS VS MINORISTAS)
// =====================================================================
// Cálculo de PVI (Minoristas) y NVI (Ballenas)
var float pvi = 1000.0
var float nvi = 1000.0
if bar_index > 0
pvi := volume > volume[1] ? pvi[1] + ((close - close[1]) / close[1]) * pvi[1] : pvi[1]
nvi := volume < volume[1] ? nvi[1] + ((close - close[1]) / close[1]) * nvi[1] : nvi[1]
// Oscilación de Minoristas (Manos Débiles)
pvim = ta.ema(pvi, 15)
pvimax = ta.highest(pvim, 90)
pvimin = ta.lowest(pvim, 90)
minoristas = (pvi - pvim) * 100 / math.max(pvimax - pvimin, 1)
// Oscilación de Ballenas (Manos Fuertes)
nvim = ta.ema(nvi, 15)
nvimax = ta.highest(nvim, 90)
nvimin = ta.lowest(nvim, 90)
ballenas = (nvi - nvim) * 100 / math.max(nvimax - nvimin, 1)
plot(minoristas, color=color.new(color.green, 40), style=plot.style_area, title="Volumen Minorista (Verde)")
plot(ballenas, color=color.new(color.blue, 20), style=plot.style_area, title="Volumen Ballenas (Azul)")
// =====================================================================
// 2. INDICADOR DE MOMENTUM (MACD)
// =====================================================================
[macdLine, signalLine, hist] = ta.macd(close, 12, 26, 9)
escala_momentum = 5 // Multiplicador para igualar la escala del Konkorde visualmente
color_hist = hist > hist[1] ? color.new(color.orange, 0) : color.new(color.red, 0)
plot(hist * escala_momentum, color=color_hist, style=plot.style_columns, title="Momentum (Columnas)")
hline(0, color=color.gray, linestyle=hline.style_dashed)
// =====================================================================
// 3. MEDIAS MÓVILES CONFIGURABLES (Proyectadas al gráfico superior)
// =====================================================================
len1 = input.int(9, title="Longitud EMA 1")
len2 = input.int(21, title="Longitud EMA 2")
len3 = input.int(50, title="Longitud EMA 3")
ema1 = ta.ema(close, len1)
ema2 = ta.ema(close, len2)
ema3 = ta.ema(close, len3)
// El uso de force_overlay=true envía estas líneas a las velas japonesas
plot(ema1, color=color.new(color.yellow, 0), linewidth=2, title="EMA Rápida", force_overlay=true)
plot(ema2, color=color.new(color.white, 0), linewidth=2, title="EMA Media", force_overlay=true)
plot(ema3, color=color.new(color.purple, 0), linewidth=2, title="EMA Lenta", force_overlay=true)
// =====================================================================
// 4. RETROCESO DE FIBONACCI (Proyectado al gráfico superior)
// =====================================================================
fibo_lookback = input.int(100, title="Periodo para Fibonacci")
hh = ta.highest(high, fibo_lookback)
ll = ta.lowest(low, fibo_lookback)
diff = hh - ll
plot(hh, color=color.new(color.red, 50), title="100% (Máximo)", force_overlay=true)
plot(hh - diff * 0.236, color=color.new(color.gray, 60), title="76.4%", force_overlay=true)
plot(hh - diff * 0.382, color=color.new(color.gray, 60), title="61.8%", force_overlay=true)
plot(hh - diff * 0.500, color=color.new(color.aqua, 20), linewidth=2, title="50.0% (Equilibrio)", force_overlay=true)
plot(hh - diff * 0.618, color=color.new(color.gray, 60), title="38.2%", force_overlay=true)
plot(ll, color=color.new(color.green, 50), title="0% (Mínimo)", force_overlay=true)
//version=6
indicator("Sistema Swing Completo (Konkorde + MAs + Fibo)", overlay=false)
// =====================================================================
// 1. KONCORDE (VOLUMEN DE BALLENAS VS MINORISTAS)
// =====================================================================
// Cálculo de PVI (Minoristas) y NVI (Ballenas)
var float pvi = 1000.0
var float nvi = 1000.0
if bar_index > 0
pvi := volume > volume[1] ? pvi[1] + ((close - close[1]) / close[1]) * pvi[1] : pvi[1]
nvi := volume < volume[1] ? nvi[1] + ((close - close[1]) / close[1]) * nvi[1] : nvi[1]
// Oscilación de Minoristas (Manos Débiles)
pvim = ta.ema(pvi, 15)
pvimax = ta.highest(pvim, 90)
pvimin = ta.lowest(pvim, 90)
minoristas = (pvi - pvim) * 100 / math.max(pvimax - pvimin, 1)
// Oscilación de Ballenas (Manos Fuertes)
nvim = ta.ema(nvi, 15)
nvimax = ta.highest(nvim, 90)
nvimin = ta.lowest(nvim, 90)
ballenas = (nvi - nvim) * 100 / math.max(nvimax - nvimin, 1)
plot(minoristas, color=color.new(color.green, 40), style=plot.style_area, title="Volumen Minorista (Verde)")
plot(ballenas, color=color.new(color.blue, 20), style=plot.style_area, title="Volumen Ballenas (Azul)")
// =====================================================================
// 2. INDICADOR DE MOMENTUM (MACD)
// =====================================================================
[macdLine, signalLine, hist] = ta.macd(close, 12, 26, 9)
escala_momentum = 5 // Multiplicador para igualar la escala del Konkorde visualmente
color_hist = hist > hist[1] ? color.new(color.orange, 0) : color.new(color.red, 0)
plot(hist * escala_momentum, color=color_hist, style=plot.style_columns, title="Momentum (Columnas)")
hline(0, color=color.gray, linestyle=hline.style_dashed)
// =====================================================================
// 3. MEDIAS MÓVILES CONFIGURABLES (Proyectadas al gráfico superior)
// =====================================================================
len1 = input.int(9, title="Longitud EMA 1")
len2 = input.int(21, title="Longitud EMA 2")
len3 = input.int(50, title="Longitud EMA 3")
ema1 = ta.ema(close, len1)
ema2 = ta.ema(close, len2)
ema3 = ta.ema(close, len3)
// El uso de force_overlay=true envía estas líneas a las velas japonesas
plot(ema1, color=color.new(color.yellow, 0), linewidth=2, title="EMA Rápida", force_overlay=true)
plot(ema2, color=color.new(color.white, 0), linewidth=2, title="EMA Media", force_overlay=true)
plot(ema3, color=color.new(color.purple, 0), linewidth=2, title="EMA Lenta", force_overlay=true)
// =====================================================================
// 4. RETROCESO DE FIBONACCI (Proyectado al gráfico superior)
// =====================================================================
fibo_lookback = input.int(100, title="Periodo para Fibonacci")
hh = ta.highest(high, fibo_lookback)
ll = ta.lowest(low, fibo_lookback)
diff = hh - ll
plot(hh, color=color.new(color.red, 50), title="100% (Máximo)", force_overlay=true)
plot(hh - diff * 0.236, color=color.new(color.gray, 60), title="76.4%", force_overlay=true)
plot(hh - diff * 0.382, color=color.new(color.gray, 60), title="61.8%", force_overlay=true)
plot(hh - diff * 0.500, color=color.new(color.aqua, 20), linewidth=2, title="50.0% (Equilibrio)", force_overlay=true)
plot(hh - diff * 0.618, color=color.new(color.gray, 60), title="38.2%", force_overlay=true)
plot(ll, color=color.new(color.green, 50), title="0% (Mínimo)", force_overlay=true)
Nota Keluaran
LE SUME UNA TABLA DE INFLUENCIA QUE CUANDO 3/4 INDICADORES SE ALINEAN ES SEÑAL DE COMPRANota Keluaran
AGREGUE LOS PUNTOS DE VENTASkrip sumber terbuka
Dalam semangat TradingView sebenar, pencipta skrip ini telah menjadikannya sumber terbuka, jadi pedagang boleh menilai dan mengesahkan kefungsiannya. Terima kasih kepada penulis! Walaupuan anda boleh menggunakan secara percuma, ingat bahawa penerbitan semula kod ini tertakluk kepada Peraturan Dalaman.

Penafian
Maklumat dan penerbitan adalah tidak bertujuan, dan tidak membentuk, nasihat atau cadangan kewangan, pelaburan, dagangan atau jenis lain yang diberikan atau disahkan oleh TradingView. Baca lebih dalam Terma Penggunaan.
Skrip sumber terbuka
Dalam semangat TradingView sebenar, pencipta skrip ini telah menjadikannya sumber terbuka, jadi pedagang boleh menilai dan mengesahkan kefungsiannya. Terima kasih kepada penulis! Walaupuan anda boleh menggunakan secara percuma, ingat bahawa penerbitan semula kod ini tertakluk kepada Peraturan Dalaman.
Penafian
Maklumat dan penerbitan adalah tidak bertujuan, dan tidak membentuk, nasihat atau cadangan kewangan, pelaburan, dagangan atau jenis lain yang diberikan atau disahkan oleh TradingView. Baca lebih dalam Terma Penggunaan.