OPEN-SOURCE SCRIPT
Swing-to-Swing Move Analyzer
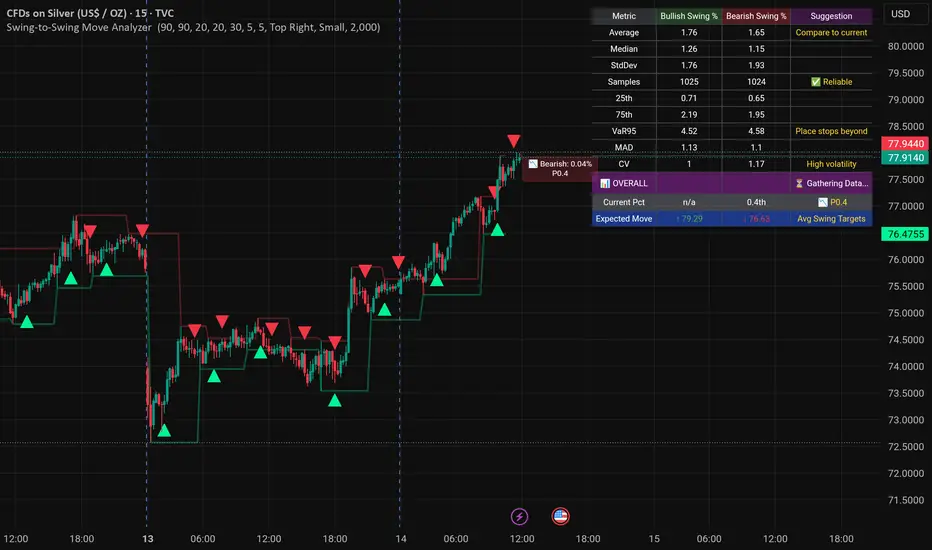
Key Features Analysis
Strengths:
Well-structured statistical analysis of pivot swings
Real-time percentile tracking of current moves
Comprehensive statistics table with tooltips
VaR95 and CV calculations for risk assessment
Visual pivot labeling and plotting
What Are Swing Moves?
The indicator identifies natural market swings by detecting pivot points:
Bullish Swing: Move from a pivot LOW to the next pivot HIGH (uptrend)
Bearish Swing: Move from a pivot HIGH to the next pivot LOW (downtrend)
Left/Right Bars Parameters
Left Bars (default: 10): How many bars to check BEFORE a pivot
Right Bars (default: 10): How many bars to check AFTER a pivot
Effect: Higher values = larger, more significant swings (less noise)
Trade-off: Lower values = more swings (more data, but potentially more false signals)
Statistics Explained
Core Statistical Measures
Statistic What It Tells You Trading Application
Average Mean swing size Baseline expectation for normal moves
Median Middle value (50th percentile) More robust than average; better for skewed distributions
StdDev Volatility/dispersion of swings Higher = unpredictable moves; Lower = consistent patterns
25th/75th Percentile Quartile boundaries 50% of swings fall between these values
VaR95 95% Value at Risk Only 5% of swings exceed this; ideal for stop placement
MAD Mean Absolute Deviation Average distance from mean; less sensitive to outliers
CV Coefficient of Variation Normalized volatility (StdDev/Mean); compares consistency
Understanding Percentile Rankings
Current Swing Percentile (Pxx) tells you where the current move ranks historically:
Reading the Real-Time Labels
The indicator shows two floating labels:
Bullish Label (Green) - From last pivot LOW to current price:
Bearish Label (Red) - From last pivot HIGH to current price:
Trading Strategies
Strategy 1: Mean Reversion (Counter-Trend)
Concept: Extremes tend to revert to the mean
Entry Signals:
Bullish swing > 85th percentile → SELL/Short
Bearish swing > 85th percentile → BUY/Long
Exit Signals:
Swing returns to 50th percentile (median)
OR price reaches opposite pivot
Strategy 2: Trend Continuation
Concept: Strong swings in the trend direction suggest momentum
Entry Signals:
In uptrend: Bullish swing > 60th percentile → ADD to long
In downtrend: Bearish swing > 60th percentile → ADD to short
Filter:
CV < 0.5 (consistent swings)
Sample size > 50 (reliable statistics)
Strategy 3: Volatility-Based Sizing
Concept: Adjust position size based on CV (Coefficient of Variation)
CV Value Volatility Position Size Stop Placement
< 0.3 Very Low 100% normal Tight (1x ATR)
0.3 - 0.7 Normal 100% normal Normal (1.5x ATR)
0.7 - 1.0 Elevated 70% normal Wide (2x ATR)
> 1.0 High 40% normal Very wide (3x ATR)
Strategy 4: Divergence Trading
Bullish Divergence Setup:
Price makes lower low (bearish)
Bullish percentile makes higher low (improving)
Signal: Potential reversal up
Bearish Divergence Setup:
Price makes higher high (bullish)
Bearish percentile makes lower high (weakening)
Signal: Potential reversal down
Quick Reference Card
Percentile Action Zones
Zone Bullish Reading Bearish Reading Action
Extreme >90 >90 Take profits/Reverse
Strong 75-90 75-90 Trail stops
Normal 25-75 25-75 Hold/Add on pullback
Weak 10-25 10-25 Wait for confirmation
Extreme Weak <10 <10 Accumulate/Distribute
Position Sizing Matrix
Confidence Sample Size CV Position %
High >100 <0.5 100%
Medium 50-100 0.5-0.7 70%
Low 30-50 0.7-1.0 50%
Very Low <30 >1.0 25%
Stop Loss Multiplier
Market Condition VaR Multiple
Low volatility (CV<0.3) 0.8× VaR95
Normal (CV 0.3-0.7) 1.0× VaR95
High volatility (CV>0.7) 1.5× VaR95
Daily Checklist
Check sample sizes (>50 reliable)
Review CV for volatility regime
Note current percentiles
Identify any divergences
Adjust position sizing accordingly
Set stops based on VaR95
Remember: Statistics are descriptive, not predictive. Use this indicator as one tool in a complete trading system that includes risk management, fundamental analysis (if applicable), and market context.
NOT A FINANCIAL ADVICE !!!
Strengths:
Well-structured statistical analysis of pivot swings
Real-time percentile tracking of current moves
Comprehensive statistics table with tooltips
VaR95 and CV calculations for risk assessment
Visual pivot labeling and plotting
What Are Swing Moves?
The indicator identifies natural market swings by detecting pivot points:
Bullish Swing: Move from a pivot LOW to the next pivot HIGH (uptrend)
Bearish Swing: Move from a pivot HIGH to the next pivot LOW (downtrend)
Left/Right Bars Parameters
Left Bars (default: 10): How many bars to check BEFORE a pivot
Right Bars (default: 10): How many bars to check AFTER a pivot
Effect: Higher values = larger, more significant swings (less noise)
Trade-off: Lower values = more swings (more data, but potentially more false signals)
Statistics Explained
Core Statistical Measures
Statistic What It Tells You Trading Application
Average Mean swing size Baseline expectation for normal moves
Median Middle value (50th percentile) More robust than average; better for skewed distributions
StdDev Volatility/dispersion of swings Higher = unpredictable moves; Lower = consistent patterns
25th/75th Percentile Quartile boundaries 50% of swings fall between these values
VaR95 95% Value at Risk Only 5% of swings exceed this; ideal for stop placement
MAD Mean Absolute Deviation Average distance from mean; less sensitive to outliers
CV Coefficient of Variation Normalized volatility (StdDev/Mean); compares consistency
Understanding Percentile Rankings
Current Swing Percentile (Pxx) tells you where the current move ranks historically:
Reading the Real-Time Labels
The indicator shows two floating labels:
Bullish Label (Green) - From last pivot LOW to current price:
Bearish Label (Red) - From last pivot HIGH to current price:
Trading Strategies
Strategy 1: Mean Reversion (Counter-Trend)
Concept: Extremes tend to revert to the mean
Entry Signals:
Bullish swing > 85th percentile → SELL/Short
Bearish swing > 85th percentile → BUY/Long
Exit Signals:
Swing returns to 50th percentile (median)
OR price reaches opposite pivot
Strategy 2: Trend Continuation
Concept: Strong swings in the trend direction suggest momentum
Entry Signals:
In uptrend: Bullish swing > 60th percentile → ADD to long
In downtrend: Bearish swing > 60th percentile → ADD to short
Filter:
CV < 0.5 (consistent swings)
Sample size > 50 (reliable statistics)
Strategy 3: Volatility-Based Sizing
Concept: Adjust position size based on CV (Coefficient of Variation)
CV Value Volatility Position Size Stop Placement
< 0.3 Very Low 100% normal Tight (1x ATR)
0.3 - 0.7 Normal 100% normal Normal (1.5x ATR)
0.7 - 1.0 Elevated 70% normal Wide (2x ATR)
> 1.0 High 40% normal Very wide (3x ATR)
Strategy 4: Divergence Trading
Bullish Divergence Setup:
Price makes lower low (bearish)
Bullish percentile makes higher low (improving)
Signal: Potential reversal up
Bearish Divergence Setup:
Price makes higher high (bullish)
Bearish percentile makes lower high (weakening)
Signal: Potential reversal down
Quick Reference Card
Percentile Action Zones
Zone Bullish Reading Bearish Reading Action
Extreme >90 >90 Take profits/Reverse
Strong 75-90 75-90 Trail stops
Normal 25-75 25-75 Hold/Add on pullback
Weak 10-25 10-25 Wait for confirmation
Extreme Weak <10 <10 Accumulate/Distribute
Position Sizing Matrix
Confidence Sample Size CV Position %
High >100 <0.5 100%
Medium 50-100 0.5-0.7 70%
Low 30-50 0.7-1.0 50%
Very Low <30 >1.0 25%
Stop Loss Multiplier
Market Condition VaR Multiple
Low volatility (CV<0.3) 0.8× VaR95
Normal (CV 0.3-0.7) 1.0× VaR95
High volatility (CV>0.7) 1.5× VaR95
Daily Checklist
Check sample sizes (>50 reliable)
Review CV for volatility regime
Note current percentiles
Identify any divergences
Adjust position sizing accordingly
Set stops based on VaR95
Remember: Statistics are descriptive, not predictive. Use this indicator as one tool in a complete trading system that includes risk management, fundamental analysis (if applicable), and market context.
NOT A FINANCIAL ADVICE !!!
Skrip sumber terbuka
Dalam semangat TradingView sebenar, pencipta skrip ini telah menjadikannya sumber terbuka, jadi pedagang boleh menilai dan mengesahkan kefungsiannya. Terima kasih kepada penulis! Walaupuan anda boleh menggunakan secara percuma, ingat bahawa penerbitan semula kod ini tertakluk kepada Peraturan Dalaman.

Penafian
Maklumat dan penerbitan adalah tidak bertujuan, dan tidak membentuk, nasihat atau cadangan kewangan, pelaburan, dagangan atau jenis lain yang diberikan atau disahkan oleh TradingView. Baca lebih dalam Terma Penggunaan.
Skrip sumber terbuka
Dalam semangat TradingView sebenar, pencipta skrip ini telah menjadikannya sumber terbuka, jadi pedagang boleh menilai dan mengesahkan kefungsiannya. Terima kasih kepada penulis! Walaupuan anda boleh menggunakan secara percuma, ingat bahawa penerbitan semula kod ini tertakluk kepada Peraturan Dalaman.
Penafian
Maklumat dan penerbitan adalah tidak bertujuan, dan tidak membentuk, nasihat atau cadangan kewangan, pelaburan, dagangan atau jenis lain yang diberikan atau disahkan oleh TradingView. Baca lebih dalam Terma Penggunaan.