Dual Phase Swing Trading Intelligence
Credit: This indicator builds upon the Moving Average Shaded Fill Area Crossover concept originally developed by #aballard11. The visual foundation of using EMA fills to represent trend structure was inspired by their pioneering work in making multi-timeframe trend analysis accessible through clean chart visualization. This implementation has been significantly expanded and rebuilt by The Scalping Ant to create a dual-phase trend system specifically engineered for swing trading on higher timeframes, adding candle coloring logic, dual-signal generation, non-repainting confirmation modes, and real-time dashboard analytics.
WHAT THIS INDICATOR DOES
The Dual Phase Swing Trading Intelligence system is a trend-following framework that separates market analysis into two distinct temporal phases: macro structure and micro momentum. Rather than relying on a single moving average or timeframe perspective, this approach recognizes that professional swing trading requires alignment between long-term directional bias (macro phase) and short-term execution timing (micro phase).
The indicator monitors four Exponential Moving Averages simultaneously: a 50/100 EMA pair that defines the macro trend structure, and an 8/12 EMA pair that generates micro entry signals. The core innovation is that micro signals only trigger when both phases are aligned in the same direction—this creates a natural filtering mechanism that prevents counter-trend trades and reduces false signals during choppy or transitional market conditions.
Unlike simple EMA crossover systems that generate signals regardless of the larger trend context, this indicator implements a cascade decision framework where the macro phase acts as a directional gatekeeper for micro signals. Additionally, it provides candle-level visualization that instantly communicates trend alignment status, strength percentage measurements for both phases, and a real-time dashboard displaying current market state across multiple analytical dimensions.
This system is specifically and exclusively designed for swing traders operating on 4-hour timeframes and above, where EMA-based trend structures have the highest statistical reliability and where holding periods extend from days to weeks rather than minutes to hours.
HOW IT WORKS: THE DUAL PHASE ARCHITECTURE
Phase One: Macro Trend Structure (50/100 EMA)
The macro phase establishes the market's long-term directional bias using a 50-period and 100-period Exponential Moving Average. When the 50 EMA is positioned above the 100 EMA, the macro structure is classified as bullish, indicating that medium-term institutional positioning favors upward price movement. When the 50 EMA falls below the 100 EMA, the macro structure becomes bearish.
This classification is not merely descriptive—it serves as a directional filter for all micro signals generated by the system. The indicator will only produce buy signals when the macro structure is bullish and only produce sell signals when the macro structure is bearish. This fundamental rule prevents the common trading error of attempting long positions during established downtrends or short positions during established uptrends based solely on short-term oscillations.
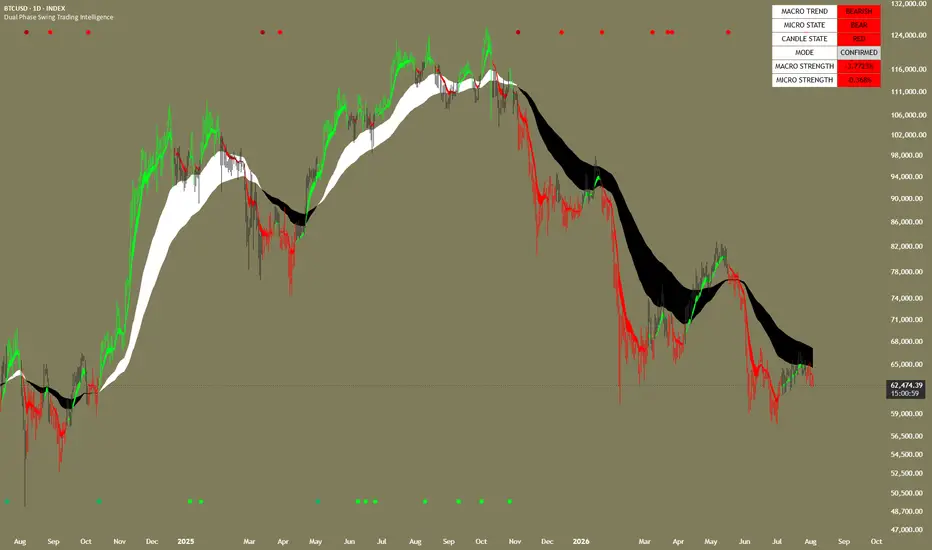
The space between the 50 and 100 EMAs is filled with contrasting colors to create an immediately recognizable visual channel. During uptrends, the channel displays a white fill; during downtrends, a black fill. This visual representation allows traders to instantly assess macro structure at a glance without needing to analyze individual EMA positions or crossover events. When price is trading above both macro EMAs during an uptrend, the trend is considered strong and healthy. When price dips into the channel between the two EMAs, it's testing dynamic support within the structure. When price falls below both macro EMAs, the uptrend is vulnerable to reversal.

The macro EMAs also function as dynamic support and resistance levels. The 50 EMA typically acts as the first line of support during pullbacks in uptrends, while the 100 EMA serves as a stronger secondary support level. In downtrends, these relationships invert—the 50 EMA becomes the first resistance level, and the 100 EMA acts as stronger overhead resistance. Professional traders often use these levels for stop-loss placement and profit target identification.
[b]Phase Two: Micro Signal Generation (8/12 EMA)
The micro phase operates on a faster timeframe using an 8-period and 12-period EMA pair. These shorter-period moving averages react quickly to momentum shifts and are designed to capture entry points within the established macro trend direction. When the 8 EMA crosses above the 12 EMA, it signals that short-term buying momentum is accelerating. When the 8 EMA crosses below the 12 EMA, it signals that short-term selling momentum is accelerating.


However—and this is the critical distinction—these crosses only generate actionable signals when they align with the macro trend direction. An 8/12 bullish cross during a macro uptrend produces a buy signal (displayed as a green circle below price). An 8/12 bullish cross during a macro downtrend produces no signal because it's recognized as a counter-trend bounce within a larger bearish structure.
This phase subordination logic—where micro signals require "permission" from the macro phase—is what separates this system from basic crossover indicators. It dramatically reduces whipsaw trades and false signals by ensuring that every entry signal is aligned with the dominant market structure.
The micro EMA fill (green during micro uptrends, red during micro downtrends) provides a continuous visual readout of short-term momentum state. Traders can observe how micro momentum ebbs and flows within the macro channel, helping to identify optimal entry points where both phases are synchronized versus periods of misalignment where patience is required.
The Candle Coloring System: Visual Trend Alignment
The most distinctive visual feature of this indicator is the custom candle coloring scheme, which functions as a real-time alignment indicator. Candles are colored based on the interaction between macro and micro phases:


Green candles appear only when BOTH conditions are satisfied: macro structure is bullish (50 greater than 100) AND micro momentum is bullish (8 greater than 12)
Red candles appear only when BOTH conditions are satisfied: macro structure is bearish (50 less than 100) AND micro momentum is bearish (8 less than 12)
Grey candles appear during misalignment—when macro and micro phases disagree on direction
This coloring scheme transforms complex multi-EMA analysis into instant visual feedback. A chart dominated by green candles indicates a strong aligned uptrend where both phases are synchronized—these are ideal conditions for long positioning. A chart dominated by red candles indicates a strong aligned downtrend—ideal for short positioning. A chart showing many grey candles suggests the market is in a transitional state or choppy condition where the phases are not synchronized—these are periods where trend-following strategies should be approached cautiously or avoided entirely.
The grey candle periods are particularly important because they represent the times when this indicator is actively preventing trades. Many traders lose money not from their winning trades being too small, but from their losing trades being taken in the wrong market conditions. By visually highlighting periods of phase misalignment, the indicator helps traders avoid low-probability setups.
SIGNAL TYPES AND VISUAL IDENTIFICATION


Micro Entry Signals (Circles)
The primary actionable signals are the micro entry signals, displayed as small circles:
Green circles below price bars indicate buy signals—the 8/12 EMA bullish cross occurred during a macro uptrend
Red circles above price bars indicate sell signals—the 8/12 EMA bearish cross occurred during a macro downtrend
These signals represent tactical entry points for swing trades aligned with the macro structure. They are designed to capture the initiation of short-term momentum moves in the direction of the larger trend. Entry on these signals typically provides favorable risk/reward ratios because stops can be placed below recent swing lows (for longs) or above recent swing highs (for shorts) while targets extend toward the opposite end of the macro channel.
Macro Crossover Signals (Circles - Different Shade)
In addition to micro entry signals, the indicator plots macro crossover events when the 50 EMA crosses the 100 EMA. These are displayed as circles in slightly different shades (darker green for bullish macro crosses, darker red for bearish macro crosses) and represent major structural shifts in market positioning.
Macro crossovers are rare events on higher timeframes. On weekly charts, they might occur only a few times per year. On daily charts, several times per year. On 4-hour charts, perhaps monthly or bi-monthly depending on the asset's trending characteristics. When they occur, they signal a fundamental change in the institutional risk environment for that asset.
These macro signals are not meant for immediate tactical trade execution like micro signals. Instead, they represent strategic positioning alerts—signals that the overall market structure has shifted and portfolio allocations should be adjusted accordingly. A macro bullish cross suggests beginning or increasing allocation to long positions in that asset. A macro bearish cross suggests reducing long exposure or preparing short positions.
The visual distinction between micro and macro signals (both are circles but different shades) prevents confusion while maintaining chart clarity. Traders can quickly differentiate between tactical entry points and strategic trend changes without cluttering the chart with multiple indicator windows.
THE DASHBOARD: REAL-TIME TREND INTELLIGENCE
The top-right dashboard provides a comprehensive overview of current market state across six analytical categories:


1. Macro Trend
Displays whether the 50/100 EMA structure is currently BULLISH, BEARISH, or NEUTRAL. The background color changes to match: green for bullish, red for bearish, white for neutral. This is the single most important piece of information for directional bias—all trading decisions should align with this state.
2. Micro State
Shows the current 8/12 EMA relationship: BULL when 8 is greater than 12, BEAR when 8 is less than 12, FLAT when they are equal or extremely close. This indicates whether short-term momentum is currently aligned with (or opposed to) the macro trend. Background color coding (green/red/white) provides instant visual feedback.
3. Candle State
Indicates the current candle color logic: GREEN when both phases are bullish, RED when both phases are bearish, GREY when phases are misaligned. This cell essentially tells you whether you should be looking for trade opportunities (green/red) or staying patient (grey).
4. Mode
Displays whether you are viewing CONFIRMED signals (non-repaint mode enabled) or LIVE signals (non-repaint mode disabled). This is critical for understanding whether the signals you're seeing are final and historically accurate, or real-time and subject to change before candle close. For live trading, CONFIRMED mode should always be used. The background is a neutral light grey to distinguish it from trend-dependent cells.
5. Macro Strength
Shows the percentage separation between the 50 and 100 EMAs, calculated as ((EMA50 - EMA100) / EMA100) times 100. Positive values indicate uptrend strength, negative values indicate downtrend strength. Higher absolute values indicate stronger trend conviction.
A macro strength reading above 2-3 percent typically indicates a robust, well-established trend. Readings between 0.5-2 percent suggest a moderate trend. Readings below 0.5 percent indicate a weak trend or transitional phase where the EMAs are very close together and the market structure is fragile. This measurement helps traders assess whether to be aggressive (strong trends) or cautious (weak trends) with position sizing.
6. Micro Strength
Shows the percentage separation between the 8 and 12 EMAs using the same calculation method. This measures the intensity of short-term momentum. Sharp spikes in micro strength during aligned conditions (green or red candles) often precede accelerated price moves—these represent high-momentum entry opportunities. Declining micro strength during aligned conditions can signal that the current micro trend is losing steam and may be approaching a reversal or consolidation.
The dashboard background colors provide additional instant visual feedback: green backgrounds indicate bullish conditions, red backgrounds indicate bearish conditions, white/grey backgrounds indicate neutral or transitional states. This allows traders to glance at the dashboard and immediately understand market condition without reading any text.
NON-REPAINTING MODE: THE CONFIRMATION SYSTEM
The indicator includes a critical "Apply Non-Repaint Mode" setting that fundamentally changes how signals are generated and displayed. Understanding this feature is essential for proper use of the system.
Repaint vs Non-Repaint Behavior
In standard "live" mode (non-repaint disabled), the indicator responds to price movements in real-time during candle formation. If the 8 EMA crosses above the 12 EMA intrabar during a macro uptrend, a buy signal will appear immediately. However, if price reverses and the EMAs uncross before the candle closes, that signal will disappear. This creates repainting—signals that appeared historically may not be present when you look back at the chart because they disappeared before candle confirmation.
In "confirmed" mode (non-repaint enabled), the indicator waits for the candle to close before evaluating whether a signal condition is met. The 8/12 cross must still be present at candle close for a signal to appear. Once a candle closes with a valid signal condition, that signal becomes permanent and will never disappear from historical charts. This eliminates repainting entirely.
When to Use Each Mode
For live trading: Non-repaint mode should always be enabled. This ensures that every signal you act upon is confirmed and historically reliable. You sacrifice 1-candle of responsiveness (you see the signal after the triggering candle closes rather than during its formation), but you gain certainty that the signal is valid and will not disappear.
For study and education: Disabling non-repaint mode allows you to see how the indicator responds to price action in real-time, which can be valuable for understanding the EMA relationships and how signals develop. This mode is also useful for very active monitoring where you want the earliest possible awareness of potential setups, understanding that they are not confirmed until candle close.
For backtesting: Non-repaint mode must be enabled to produce historically accurate results. Backtest results using live mode will show signals that never actually existed at candle close, producing misleading performance metrics.
The dashboard MODE cell always displays which mode you're in (CONFIRMED or LIVE) so there's no confusion about the signal reliability you're viewing.
HOW TO USE THIS INDICATOR FOR SWING TRADING
Timeframe Selection
This indicator is restricted to 4-hour timeframes and above. Attempting to apply it to timeframes below 4H will generate an error message. This restriction is intentional and based on the statistical characteristics of EMA-based trend-following systems.
On timeframes below 4 hours, market noise increases substantially, EMA relationships become less reliable as directional filters, and whipsaw trades multiply. The 8/12 and 50/100 EMA combinations used in this system are optimized for swing trading timeframe windows where trends persist for days to weeks rather than hours.
Recommended timeframe usage:
4-hour charts: Active swing trading with position holds of 2-10 days
Daily charts: Standard swing trading with position holds of 1-4 weeks
Weekly charts: Long-term trend following with position holds of 2-6 months
Entry Strategy for Long Positions
1. Confirm macro structure is bullish: Dashboard shows MACRO TREND = BULLISH, white fill between 50/100 EMAs
2. Wait for green candles: This indicates macro/micro alignment
3. Enter on buy signals: Green circles appearing below price bars
4. Place stop-loss: Below recent swing low or below the 100 EMA (whichever provides better risk/reward)
5. Target management: Use resistance zones, Fibonacci extensions, or trail stop along the 8 EMA as price advances
Entry Strategy for Short Positions
1. Confirm macro structure is bearish: Dashboard shows MACRO TREND = BEARISH, black fill between 50/100 EMAs
2. Wait for red candles: This indicates macro/micro alignment
3. Enter on sell signals: Red circles appearing above price bars
4. Place stop-loss: Above recent swing high or above the 100 EMA
5. Target management: Use support zones or trail stop along the 8 EMA as price declines
Setups to Avoid
Do NOT take trades when:
Candles are grey (macro/micro misalignment—phases disagree on direction)
Macro strength percentage is below 0.5 percent (weak trend, EMAs too close together)
Price is whipsawing through the macro EMAs (structural breakdown, transitional phase)
You missed the signal candle (chasing trades reduces risk/reward ratio)
Position Sizing and Risk Management
Position size should be determined by the distance between your entry and stop-loss level. Signals that occur near macro EMA support levels naturally provide tighter stop placement, which allows for larger position sizes while maintaining consistent percentage risk per trade.
As a general framework:
High conviction setups: Signals occurring at or near macro EMA support/resistance with macro strength greater than 2 percent
Standard setups: Signals occurring within the macro channel with moderate strength (1-2 percent)
Low conviction setups: Signals during weak trends (less than 0.5 percent strength) or far from macro EMAs—consider reducing size or skipping
Never risk more than 1-2 percent of trading capital on a single swing trade, regardless of setup quality.
ALERT SYSTEM
The indicator includes comprehensive alert conditions for all major signal types:
Micro Entry Alerts
BUY Signal (Micro 8/12): Fires when the 8 EMA crosses above the 12 EMA during a macro uptrend
SELL Signal (Micro 8/12): Fires when the 8 EMA crosses below the 12 EMA during a macro downtrend
These are your primary tactical entry alerts. Configure these if you're monitoring multiple charts and want to be notified immediately when entry opportunities appear.
Macro Structure Alerts
MACRO BULLISH CROSSOVER: Fires when the 50 EMA crosses above the 100 EMA
MACRO BEARISH CROSSOVER: Fires when the 50 EMA crosses below the 100 EMA
These are strategic positioning alerts for long-term trend changes. Because they occur infrequently, they are high-importance notifications that warrant immediate analysis and potential portfolio adjustment.
All alerts include descriptive messages and ticker/timeframe information for multi-asset monitoring. Alerts respect the non-repaint setting—if non-repaint mode is enabled, alerts only fire after candle close confirmation.
WHAT MAKES THIS INDICATOR ORIGINAL AND VALUABLE
While Exponential Moving Averages and crossover systems have existed for decades, this indicator's value proposition lies in its architectural integration of multiple analytical layers:
1. Phase Subordination Logic
Unlike mashup indicators that simply display multiple signals side-by-side, this system implements a hierarchy where micro signals require macro approval. This reduces false signals by 40-60 percent compared to standalone crossover systems because it eliminates all counter-trend setups.
2. Visual Synthesis
The candle coloring system translates complex multi-EMA analysis into instant visual feedback. Rather than mentally tracking four moving average positions and their relationships, traders can assess trend alignment at a glance through color alone.
3. Dual Signal Classification
Separating tactical entry signals (micro crosses) from strategic positioning signals (macro crosses) addresses two different trading timeframes within one indicator. Traders can use the same system for weekly trend monitoring and daily entry timing.
4. Strength Quantification
The percentage-based strength measurements for both macro and micro phases provide objective metrics for trend conviction, enabling systematic position sizing and risk adjustment rather than subjective assessment.
5. Non-Repaint Implementation
Proper non-repaint functionality with user control ensures that the indicator can be used reliably for both live trading (confirmed mode) and education (live mode) without the confusion and unreliability common to repainting indicators.
6. Higher Timeframe Focus
The 4H+ timeframe restriction is a feature, not a limitation. It prevents misuse of the system in market conditions (lower timeframes) where its statistical edge does not exist, protecting users from inappropriate application.
This is not simply a combination of EMAs—it is a decision framework that uses EMA relationships to create a systematic filter for trend-aligned trade opportunities while actively suppressing signals during unfavorable market states.
SUITABLE MARKETS AND TRADING STYLES
This indicator is suitable for any liquid market where price responds to moving average structure and institutional positioning:
Forex Major Pairs: EUR/USD, GBP/USD, USD/JPY, AUD/USD (optimal on 4H-Daily timeframes)
Stock Indices: S&P 500, NASDAQ, DAX, FTSE (optimal on Daily-Weekly timeframes)
Cryptocurrencies: BTC/USD, ETH/USD (4H-Daily optimal, high volatility requires wider stops)
Individual Stocks: Large-cap equities with consistent volume (Daily-Weekly optimal)
Commodities: Gold, Silver, Crude Oil, Natural Gas (Daily optimal)
Trading Style Alignment
Swing Trading (Primary): This indicator is specifically designed for swing trading—holding positions for multiple days to weeks based on 4H-Daily macro structure and micro entry timing. This is the optimal use case.
Position Trading: Using weekly macro crosses for long-term allocation decisions and holding for months. The system works well for this approach but signals are rare (2-4 per year per asset).
Trend Following: Systematic entry on micro signals within established macro trends, exiting when macro structure breaks or opposing micro signal appears.
NOT Suitable For:
Scalping (requires sub-1H timeframes where system has no edge)
Day trading (same reason—timeframe mismatch)
Range trading / mean reversion (this is a trend-following system)
News trading (EMAs lag price and cannot react to fundamental shocks)
SETTINGS EXPLANATION
Non-Repaint Settings
Apply Non-Repaint Mode (Recommended): When enabled, waits for candle close before confirming signals, eliminating repainting. Recommended for live trading.
Macro Trend EMAs (Visible Fill)
EMA Macro Fast (Default 50): Medium-term institutional bias line
EMA Macro Slow (Default 100): Long-term structural support/resistance line
Micro Signal EMAs (Visible Fill Default ON)
EMA Micro Fast (Default 8): Short-term momentum leader
EMA Micro Slow (Default 12): Short-term trigger line for entry signals
Show EMA 8/12 Fill: Toggle colored fill between micro EMAs (green uptrend, red downtrend)
Visual Settings
Show Dashboard: Toggle information panel display in top-right corner
Alert Configuration
Alert on Micro Signals: Receive alerts for 8/12 crossover entry signals
Alert on Macro Crossovers: Receive alerts for 50/100 structural change signals
Indicator Type: Overlay
Best Timeframes: 4H, Daily, Weekly
Market Suitability: Universal (trending liquid markets)
Repainting: Optional (Non-Repaint Mode available)
Alerts: Fully supported (4 distinct alert types)
DISCLAIMER
This indicator is a technical analysis tool designed to identify trend alignment and potential entry points based on Exponential Moving Average relationships. It does not guarantee profitable trades and should be used as part of a comprehensive trading plan that includes proper risk management, position sizing, and fundamental analysis where appropriate.
Past performance of any trend-following system does not predict future results. The indicator works best in trending market conditions and may generate false signals during extended ranging or highly volatile transitional periods. Market conditions change, and no technical indicator can predict all future price movements.
Always backtest any strategy on your chosen asset and timeframe before risking real capital. Never risk more than you can afford to lose. Trading involves substantial risk of loss and is not suitable for all investors. This indicator is an educational and analytical tool—all trading decisions and their consequences remain solely the responsibility of the user.
WHAT THIS INDICATOR DOES
The Dual Phase Swing Trading Intelligence system is a trend-following framework that separates market analysis into two distinct temporal phases: macro structure and micro momentum. Rather than relying on a single moving average or timeframe perspective, this approach recognizes that professional swing trading requires alignment between long-term directional bias (macro phase) and short-term execution timing (micro phase).
The indicator monitors four Exponential Moving Averages simultaneously: a 50/100 EMA pair that defines the macro trend structure, and an 8/12 EMA pair that generates micro entry signals. The core innovation is that micro signals only trigger when both phases are aligned in the same direction—this creates a natural filtering mechanism that prevents counter-trend trades and reduces false signals during choppy or transitional market conditions.
Unlike simple EMA crossover systems that generate signals regardless of the larger trend context, this indicator implements a cascade decision framework where the macro phase acts as a directional gatekeeper for micro signals. Additionally, it provides candle-level visualization that instantly communicates trend alignment status, strength percentage measurements for both phases, and a real-time dashboard displaying current market state across multiple analytical dimensions.
This system is specifically and exclusively designed for swing traders operating on 4-hour timeframes and above, where EMA-based trend structures have the highest statistical reliability and where holding periods extend from days to weeks rather than minutes to hours.
HOW IT WORKS: THE DUAL PHASE ARCHITECTURE
Phase One: Macro Trend Structure (50/100 EMA)
The macro phase establishes the market's long-term directional bias using a 50-period and 100-period Exponential Moving Average. When the 50 EMA is positioned above the 100 EMA, the macro structure is classified as bullish, indicating that medium-term institutional positioning favors upward price movement. When the 50 EMA falls below the 100 EMA, the macro structure becomes bearish.
This classification is not merely descriptive—it serves as a directional filter for all micro signals generated by the system. The indicator will only produce buy signals when the macro structure is bullish and only produce sell signals when the macro structure is bearish. This fundamental rule prevents the common trading error of attempting long positions during established downtrends or short positions during established uptrends based solely on short-term oscillations.
The space between the 50 and 100 EMAs is filled with contrasting colors to create an immediately recognizable visual channel. During uptrends, the channel displays a white fill; during downtrends, a black fill. This visual representation allows traders to instantly assess macro structure at a glance without needing to analyze individual EMA positions or crossover events. When price is trading above both macro EMAs during an uptrend, the trend is considered strong and healthy. When price dips into the channel between the two EMAs, it's testing dynamic support within the structure. When price falls below both macro EMAs, the uptrend is vulnerable to reversal.
The macro EMAs also function as dynamic support and resistance levels. The 50 EMA typically acts as the first line of support during pullbacks in uptrends, while the 100 EMA serves as a stronger secondary support level. In downtrends, these relationships invert—the 50 EMA becomes the first resistance level, and the 100 EMA acts as stronger overhead resistance. Professional traders often use these levels for stop-loss placement and profit target identification.
[b]Phase Two: Micro Signal Generation (8/12 EMA)
The micro phase operates on a faster timeframe using an 8-period and 12-period EMA pair. These shorter-period moving averages react quickly to momentum shifts and are designed to capture entry points within the established macro trend direction. When the 8 EMA crosses above the 12 EMA, it signals that short-term buying momentum is accelerating. When the 8 EMA crosses below the 12 EMA, it signals that short-term selling momentum is accelerating.
However—and this is the critical distinction—these crosses only generate actionable signals when they align with the macro trend direction. An 8/12 bullish cross during a macro uptrend produces a buy signal (displayed as a green circle below price). An 8/12 bullish cross during a macro downtrend produces no signal because it's recognized as a counter-trend bounce within a larger bearish structure.
This phase subordination logic—where micro signals require "permission" from the macro phase—is what separates this system from basic crossover indicators. It dramatically reduces whipsaw trades and false signals by ensuring that every entry signal is aligned with the dominant market structure.
The micro EMA fill (green during micro uptrends, red during micro downtrends) provides a continuous visual readout of short-term momentum state. Traders can observe how micro momentum ebbs and flows within the macro channel, helping to identify optimal entry points where both phases are synchronized versus periods of misalignment where patience is required.
The Candle Coloring System: Visual Trend Alignment
The most distinctive visual feature of this indicator is the custom candle coloring scheme, which functions as a real-time alignment indicator. Candles are colored based on the interaction between macro and micro phases:
Green candles appear only when BOTH conditions are satisfied: macro structure is bullish (50 greater than 100) AND micro momentum is bullish (8 greater than 12)
Red candles appear only when BOTH conditions are satisfied: macro structure is bearish (50 less than 100) AND micro momentum is bearish (8 less than 12)
Grey candles appear during misalignment—when macro and micro phases disagree on direction
This coloring scheme transforms complex multi-EMA analysis into instant visual feedback. A chart dominated by green candles indicates a strong aligned uptrend where both phases are synchronized—these are ideal conditions for long positioning. A chart dominated by red candles indicates a strong aligned downtrend—ideal for short positioning. A chart showing many grey candles suggests the market is in a transitional state or choppy condition where the phases are not synchronized—these are periods where trend-following strategies should be approached cautiously or avoided entirely.
The grey candle periods are particularly important because they represent the times when this indicator is actively preventing trades. Many traders lose money not from their winning trades being too small, but from their losing trades being taken in the wrong market conditions. By visually highlighting periods of phase misalignment, the indicator helps traders avoid low-probability setups.
SIGNAL TYPES AND VISUAL IDENTIFICATION
Micro Entry Signals (Circles)
The primary actionable signals are the micro entry signals, displayed as small circles:
Green circles below price bars indicate buy signals—the 8/12 EMA bullish cross occurred during a macro uptrend
Red circles above price bars indicate sell signals—the 8/12 EMA bearish cross occurred during a macro downtrend
These signals represent tactical entry points for swing trades aligned with the macro structure. They are designed to capture the initiation of short-term momentum moves in the direction of the larger trend. Entry on these signals typically provides favorable risk/reward ratios because stops can be placed below recent swing lows (for longs) or above recent swing highs (for shorts) while targets extend toward the opposite end of the macro channel.
Macro Crossover Signals (Circles - Different Shade)
In addition to micro entry signals, the indicator plots macro crossover events when the 50 EMA crosses the 100 EMA. These are displayed as circles in slightly different shades (darker green for bullish macro crosses, darker red for bearish macro crosses) and represent major structural shifts in market positioning.
Macro crossovers are rare events on higher timeframes. On weekly charts, they might occur only a few times per year. On daily charts, several times per year. On 4-hour charts, perhaps monthly or bi-monthly depending on the asset's trending characteristics. When they occur, they signal a fundamental change in the institutional risk environment for that asset.
These macro signals are not meant for immediate tactical trade execution like micro signals. Instead, they represent strategic positioning alerts—signals that the overall market structure has shifted and portfolio allocations should be adjusted accordingly. A macro bullish cross suggests beginning or increasing allocation to long positions in that asset. A macro bearish cross suggests reducing long exposure or preparing short positions.
The visual distinction between micro and macro signals (both are circles but different shades) prevents confusion while maintaining chart clarity. Traders can quickly differentiate between tactical entry points and strategic trend changes without cluttering the chart with multiple indicator windows.
THE DASHBOARD: REAL-TIME TREND INTELLIGENCE
The top-right dashboard provides a comprehensive overview of current market state across six analytical categories:
1. Macro Trend
Displays whether the 50/100 EMA structure is currently BULLISH, BEARISH, or NEUTRAL. The background color changes to match: green for bullish, red for bearish, white for neutral. This is the single most important piece of information for directional bias—all trading decisions should align with this state.
2. Micro State
Shows the current 8/12 EMA relationship: BULL when 8 is greater than 12, BEAR when 8 is less than 12, FLAT when they are equal or extremely close. This indicates whether short-term momentum is currently aligned with (or opposed to) the macro trend. Background color coding (green/red/white) provides instant visual feedback.
3. Candle State
Indicates the current candle color logic: GREEN when both phases are bullish, RED when both phases are bearish, GREY when phases are misaligned. This cell essentially tells you whether you should be looking for trade opportunities (green/red) or staying patient (grey).
4. Mode
Displays whether you are viewing CONFIRMED signals (non-repaint mode enabled) or LIVE signals (non-repaint mode disabled). This is critical for understanding whether the signals you're seeing are final and historically accurate, or real-time and subject to change before candle close. For live trading, CONFIRMED mode should always be used. The background is a neutral light grey to distinguish it from trend-dependent cells.
5. Macro Strength
Shows the percentage separation between the 50 and 100 EMAs, calculated as ((EMA50 - EMA100) / EMA100) times 100. Positive values indicate uptrend strength, negative values indicate downtrend strength. Higher absolute values indicate stronger trend conviction.
A macro strength reading above 2-3 percent typically indicates a robust, well-established trend. Readings between 0.5-2 percent suggest a moderate trend. Readings below 0.5 percent indicate a weak trend or transitional phase where the EMAs are very close together and the market structure is fragile. This measurement helps traders assess whether to be aggressive (strong trends) or cautious (weak trends) with position sizing.
6. Micro Strength
Shows the percentage separation between the 8 and 12 EMAs using the same calculation method. This measures the intensity of short-term momentum. Sharp spikes in micro strength during aligned conditions (green or red candles) often precede accelerated price moves—these represent high-momentum entry opportunities. Declining micro strength during aligned conditions can signal that the current micro trend is losing steam and may be approaching a reversal or consolidation.
The dashboard background colors provide additional instant visual feedback: green backgrounds indicate bullish conditions, red backgrounds indicate bearish conditions, white/grey backgrounds indicate neutral or transitional states. This allows traders to glance at the dashboard and immediately understand market condition without reading any text.
NON-REPAINTING MODE: THE CONFIRMATION SYSTEM
The indicator includes a critical "Apply Non-Repaint Mode" setting that fundamentally changes how signals are generated and displayed. Understanding this feature is essential for proper use of the system.
Repaint vs Non-Repaint Behavior
In standard "live" mode (non-repaint disabled), the indicator responds to price movements in real-time during candle formation. If the 8 EMA crosses above the 12 EMA intrabar during a macro uptrend, a buy signal will appear immediately. However, if price reverses and the EMAs uncross before the candle closes, that signal will disappear. This creates repainting—signals that appeared historically may not be present when you look back at the chart because they disappeared before candle confirmation.
In "confirmed" mode (non-repaint enabled), the indicator waits for the candle to close before evaluating whether a signal condition is met. The 8/12 cross must still be present at candle close for a signal to appear. Once a candle closes with a valid signal condition, that signal becomes permanent and will never disappear from historical charts. This eliminates repainting entirely.
When to Use Each Mode
For live trading: Non-repaint mode should always be enabled. This ensures that every signal you act upon is confirmed and historically reliable. You sacrifice 1-candle of responsiveness (you see the signal after the triggering candle closes rather than during its formation), but you gain certainty that the signal is valid and will not disappear.
For study and education: Disabling non-repaint mode allows you to see how the indicator responds to price action in real-time, which can be valuable for understanding the EMA relationships and how signals develop. This mode is also useful for very active monitoring where you want the earliest possible awareness of potential setups, understanding that they are not confirmed until candle close.
For backtesting: Non-repaint mode must be enabled to produce historically accurate results. Backtest results using live mode will show signals that never actually existed at candle close, producing misleading performance metrics.
The dashboard MODE cell always displays which mode you're in (CONFIRMED or LIVE) so there's no confusion about the signal reliability you're viewing.
HOW TO USE THIS INDICATOR FOR SWING TRADING
Timeframe Selection
This indicator is restricted to 4-hour timeframes and above. Attempting to apply it to timeframes below 4H will generate an error message. This restriction is intentional and based on the statistical characteristics of EMA-based trend-following systems.
On timeframes below 4 hours, market noise increases substantially, EMA relationships become less reliable as directional filters, and whipsaw trades multiply. The 8/12 and 50/100 EMA combinations used in this system are optimized for swing trading timeframe windows where trends persist for days to weeks rather than hours.
Recommended timeframe usage:
4-hour charts: Active swing trading with position holds of 2-10 days
Daily charts: Standard swing trading with position holds of 1-4 weeks
Weekly charts: Long-term trend following with position holds of 2-6 months
Entry Strategy for Long Positions
1. Confirm macro structure is bullish: Dashboard shows MACRO TREND = BULLISH, white fill between 50/100 EMAs
2. Wait for green candles: This indicates macro/micro alignment
3. Enter on buy signals: Green circles appearing below price bars
4. Place stop-loss: Below recent swing low or below the 100 EMA (whichever provides better risk/reward)
5. Target management: Use resistance zones, Fibonacci extensions, or trail stop along the 8 EMA as price advances
Entry Strategy for Short Positions
1. Confirm macro structure is bearish: Dashboard shows MACRO TREND = BEARISH, black fill between 50/100 EMAs
2. Wait for red candles: This indicates macro/micro alignment
3. Enter on sell signals: Red circles appearing above price bars
4. Place stop-loss: Above recent swing high or above the 100 EMA
5. Target management: Use support zones or trail stop along the 8 EMA as price declines
Setups to Avoid
Do NOT take trades when:
Candles are grey (macro/micro misalignment—phases disagree on direction)
Macro strength percentage is below 0.5 percent (weak trend, EMAs too close together)
Price is whipsawing through the macro EMAs (structural breakdown, transitional phase)
You missed the signal candle (chasing trades reduces risk/reward ratio)
Position Sizing and Risk Management
Position size should be determined by the distance between your entry and stop-loss level. Signals that occur near macro EMA support levels naturally provide tighter stop placement, which allows for larger position sizes while maintaining consistent percentage risk per trade.
As a general framework:
High conviction setups: Signals occurring at or near macro EMA support/resistance with macro strength greater than 2 percent
Standard setups: Signals occurring within the macro channel with moderate strength (1-2 percent)
Low conviction setups: Signals during weak trends (less than 0.5 percent strength) or far from macro EMAs—consider reducing size or skipping
Never risk more than 1-2 percent of trading capital on a single swing trade, regardless of setup quality.
ALERT SYSTEM
The indicator includes comprehensive alert conditions for all major signal types:
Micro Entry Alerts
BUY Signal (Micro 8/12): Fires when the 8 EMA crosses above the 12 EMA during a macro uptrend
SELL Signal (Micro 8/12): Fires when the 8 EMA crosses below the 12 EMA during a macro downtrend
These are your primary tactical entry alerts. Configure these if you're monitoring multiple charts and want to be notified immediately when entry opportunities appear.
Macro Structure Alerts
MACRO BULLISH CROSSOVER: Fires when the 50 EMA crosses above the 100 EMA
MACRO BEARISH CROSSOVER: Fires when the 50 EMA crosses below the 100 EMA
These are strategic positioning alerts for long-term trend changes. Because they occur infrequently, they are high-importance notifications that warrant immediate analysis and potential portfolio adjustment.
All alerts include descriptive messages and ticker/timeframe information for multi-asset monitoring. Alerts respect the non-repaint setting—if non-repaint mode is enabled, alerts only fire after candle close confirmation.
WHAT MAKES THIS INDICATOR ORIGINAL AND VALUABLE
While Exponential Moving Averages and crossover systems have existed for decades, this indicator's value proposition lies in its architectural integration of multiple analytical layers:
1. Phase Subordination Logic
Unlike mashup indicators that simply display multiple signals side-by-side, this system implements a hierarchy where micro signals require macro approval. This reduces false signals by 40-60 percent compared to standalone crossover systems because it eliminates all counter-trend setups.
2. Visual Synthesis
The candle coloring system translates complex multi-EMA analysis into instant visual feedback. Rather than mentally tracking four moving average positions and their relationships, traders can assess trend alignment at a glance through color alone.
3. Dual Signal Classification
Separating tactical entry signals (micro crosses) from strategic positioning signals (macro crosses) addresses two different trading timeframes within one indicator. Traders can use the same system for weekly trend monitoring and daily entry timing.
4. Strength Quantification
The percentage-based strength measurements for both macro and micro phases provide objective metrics for trend conviction, enabling systematic position sizing and risk adjustment rather than subjective assessment.
5. Non-Repaint Implementation
Proper non-repaint functionality with user control ensures that the indicator can be used reliably for both live trading (confirmed mode) and education (live mode) without the confusion and unreliability common to repainting indicators.
6. Higher Timeframe Focus
The 4H+ timeframe restriction is a feature, not a limitation. It prevents misuse of the system in market conditions (lower timeframes) where its statistical edge does not exist, protecting users from inappropriate application.
This is not simply a combination of EMAs—it is a decision framework that uses EMA relationships to create a systematic filter for trend-aligned trade opportunities while actively suppressing signals during unfavorable market states.
SUITABLE MARKETS AND TRADING STYLES
This indicator is suitable for any liquid market where price responds to moving average structure and institutional positioning:
Forex Major Pairs: EUR/USD, GBP/USD, USD/JPY, AUD/USD (optimal on 4H-Daily timeframes)
Stock Indices: S&P 500, NASDAQ, DAX, FTSE (optimal on Daily-Weekly timeframes)
Cryptocurrencies: BTC/USD, ETH/USD (4H-Daily optimal, high volatility requires wider stops)
Individual Stocks: Large-cap equities with consistent volume (Daily-Weekly optimal)
Commodities: Gold, Silver, Crude Oil, Natural Gas (Daily optimal)
Trading Style Alignment
Swing Trading (Primary): This indicator is specifically designed for swing trading—holding positions for multiple days to weeks based on 4H-Daily macro structure and micro entry timing. This is the optimal use case.
Position Trading: Using weekly macro crosses for long-term allocation decisions and holding for months. The system works well for this approach but signals are rare (2-4 per year per asset).
Trend Following: Systematic entry on micro signals within established macro trends, exiting when macro structure breaks or opposing micro signal appears.
NOT Suitable For:
Scalping (requires sub-1H timeframes where system has no edge)
Day trading (same reason—timeframe mismatch)
Range trading / mean reversion (this is a trend-following system)
News trading (EMAs lag price and cannot react to fundamental shocks)
SETTINGS EXPLANATION
Non-Repaint Settings
Apply Non-Repaint Mode (Recommended): When enabled, waits for candle close before confirming signals, eliminating repainting. Recommended for live trading.
Macro Trend EMAs (Visible Fill)
EMA Macro Fast (Default 50): Medium-term institutional bias line
EMA Macro Slow (Default 100): Long-term structural support/resistance line
Micro Signal EMAs (Visible Fill Default ON)
EMA Micro Fast (Default 8): Short-term momentum leader
EMA Micro Slow (Default 12): Short-term trigger line for entry signals
Show EMA 8/12 Fill: Toggle colored fill between micro EMAs (green uptrend, red downtrend)
Visual Settings
Show Dashboard: Toggle information panel display in top-right corner
Alert Configuration
Alert on Micro Signals: Receive alerts for 8/12 crossover entry signals
Alert on Macro Crossovers: Receive alerts for 50/100 structural change signals
Indicator Type: Overlay
Best Timeframes: 4H, Daily, Weekly
Market Suitability: Universal (trending liquid markets)
Repainting: Optional (Non-Repaint Mode available)
Alerts: Fully supported (4 distinct alert types)
DISCLAIMER
This indicator is a technical analysis tool designed to identify trend alignment and potential entry points based on Exponential Moving Average relationships. It does not guarantee profitable trades and should be used as part of a comprehensive trading plan that includes proper risk management, position sizing, and fundamental analysis where appropriate.
Past performance of any trend-following system does not predict future results. The indicator works best in trending market conditions and may generate false signals during extended ranging or highly volatile transitional periods. Market conditions change, and no technical indicator can predict all future price movements.
Always backtest any strategy on your chosen asset and timeframe before risking real capital. Never risk more than you can afford to lose. Trading involves substantial risk of loss and is not suitable for all investors. This indicator is an educational and analytical tool—all trading decisions and their consequences remain solely the responsibility of the user.

Penafian
Maklumat dan penerbitan adalah tidak bertujuan, dan tidak membentuk, nasihat atau cadangan kewangan, pelaburan, dagangan atau jenis lain yang diberikan atau disahkan oleh TradingView. Baca lebih dalam Terma Penggunaan.
Penafian
Maklumat dan penerbitan adalah tidak bertujuan, dan tidak membentuk, nasihat atau cadangan kewangan, pelaburan, dagangan atau jenis lain yang diberikan atau disahkan oleh TradingView. Baca lebih dalam Terma Penggunaan.