OPEN-SOURCE SCRIPT
Telah dikemas kini Big Trades [Volume Anomalies] (Enhanced)
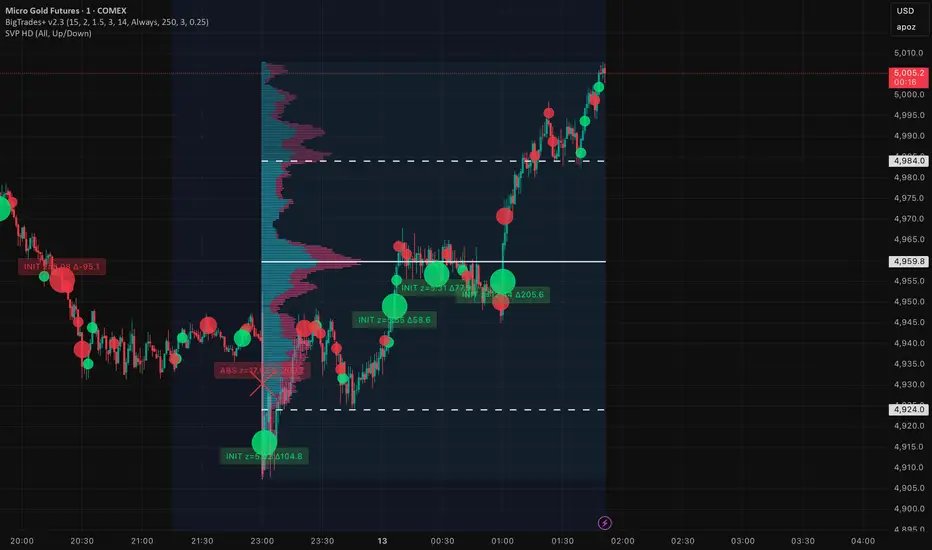
The script is a **volume-anomaly “big trades” detector** for futures that tries to (1) split each candle’s volume into a **buy-pressure** and **sell-pressure** estimate, (2) flag **statistically extreme** candles (tiers), and (3) optionally label those extremes as **initiative (follow-through)** vs **absorbed (no follow-through)** using a forward-style confirmation window.
Here’s what it does, piece by piece.
---
## 1) What it’s trying to detect
It’s not true “whale prints” or real bid/ask delta. It detects:
* **unusually large participation** (volume anomaly)
* with a **directional guess** (buy-ish vs sell-ish)
* and then checks whether price **continued** after that anomaly
So it’s: **“big participation + did it work?”**
---
## 2) The “buy vs sell volume” estimate
For each candle, it builds a **weight** for buy and sell pressure:
* **close location within the candle**
* close near high → more buy weight
* close near low → more sell weight
* **body direction (close–open)**
* bullish body adds buy boost
* bearish body adds sell boost
Then it computes:
* `raw_buy = volume * buy_weight`
* `raw_sell = volume * sell_weight`
This is an **OHLC-based proxy** for pressure, not real aggressor volume.
---
## 3) Normalization (makes it behave across sessions)
If enabled, it divides by ATR:
* `norm_buy = raw_buy / ATR`
* `norm_sell = raw_sell / ATR`
This helps a lot on futures because volume/volatility regimes differ between Asia/London/NY.
---
## 4) Statistical anomaly detection (z-score logic)
It calculates “what’s normal” using the last `lookback` bars, but **uses `[1]`** so the current bar doesn’t contaminate the stats (reduces flicker):
* `avg_buy = sma(norm_buy, lookback)[1]`
* `std_buy = stdev(norm_buy, lookback)[1]`
(and same for sell)
Then it computes **z-scores**:
* `z_buy = (norm_buy - avg_buy) / std_buy`
* `z_sell = (norm_sell - avg_sell) / std_sell`
If z-score crosses thresholds, it triggers tiers:
* Tier 1: `sigma`
* Tier 2: `sigma + tier_step1`
* Tier 3: `sigma + tier_step2`
So **Tier 3 = “big bubble”**.
---
## 5) Optional VWAP bias filter
It computes VWAP correctly as:
* `vwapv = ta.vwap(hlc3)`
If enabled:
* buys only when `close >= vwap`
* sells only when `close <= vwap`
This is just a **trend/bias filter** to reduce counter-trend bubbles.
---
## 6) Plotting (how bubbles appear)
It places markers at:
* buys around `(close+low)/2` (lower-ish)
* sells around `(close+high)/2` (upper-ish)
And draws:
* small/medium/large circles (depending on tier)
* with optional INIT/ABS overlays (explained next)
---
## 7) “Initiative vs Absorbed” classification (the smart part)
Because Pine can’t see the future on the same bar, your script does a **delayed evaluation**:
* It waits `N = confirm_bars`
* Looks at what happened from the signal bar to the current bar
* Decides if price moved far enough in the intended direction
It uses:
* `hh_window = highest(high, N+1)`
* `ll_window = lowest(low, N+1)`
(these cover the last N+1 bars: from signal bar to now)
Then it measures follow-through:
* For a buy signal N bars ago:
`buy_move = hh_window - high[N]`
* For a sell signal N bars ago:
`sell_move = low[N] - ll_window`
It compares to an ATR-based threshold anchored to the signal bar:
* `thr_move_sig = ATR[N] * move_mult_atr`
If move > threshold → **INIT**
Else → **ABS**
Then it **plots back onto the original signal bar** using `offset=-N` so it visually marks the candle that caused it.
To make it obvious:
* **INIT** = circle
* **ABS** = X
This part is “accurate” in the sense that it’s purely **price-outcome based**.
---
## 8) Labels (optional)
If enabled, it prints labels on those large signals with:
* INIT/ABS
* the z-score at the signal bar
* and a “delta proxy” (`norm_buy - norm_sell`), not true delta
---
## In one sentence
The script flags **statistically extreme volume-pressure candles** (buy/sell proxy), and then classifies those extremes as **worked (initiative)** or **failed (absorbed)** based on **subsequent price movement** within `confirm_bars`.
Here’s what it does, piece by piece.
---
## 1) What it’s trying to detect
It’s not true “whale prints” or real bid/ask delta. It detects:
* **unusually large participation** (volume anomaly)
* with a **directional guess** (buy-ish vs sell-ish)
* and then checks whether price **continued** after that anomaly
So it’s: **“big participation + did it work?”**
---
## 2) The “buy vs sell volume” estimate
For each candle, it builds a **weight** for buy and sell pressure:
* **close location within the candle**
* close near high → more buy weight
* close near low → more sell weight
* **body direction (close–open)**
* bullish body adds buy boost
* bearish body adds sell boost
Then it computes:
* `raw_buy = volume * buy_weight`
* `raw_sell = volume * sell_weight`
This is an **OHLC-based proxy** for pressure, not real aggressor volume.
---
## 3) Normalization (makes it behave across sessions)
If enabled, it divides by ATR:
* `norm_buy = raw_buy / ATR`
* `norm_sell = raw_sell / ATR`
This helps a lot on futures because volume/volatility regimes differ between Asia/London/NY.
---
## 4) Statistical anomaly detection (z-score logic)
It calculates “what’s normal” using the last `lookback` bars, but **uses `[1]`** so the current bar doesn’t contaminate the stats (reduces flicker):
* `avg_buy = sma(norm_buy, lookback)[1]`
* `std_buy = stdev(norm_buy, lookback)[1]`
(and same for sell)
Then it computes **z-scores**:
* `z_buy = (norm_buy - avg_buy) / std_buy`
* `z_sell = (norm_sell - avg_sell) / std_sell`
If z-score crosses thresholds, it triggers tiers:
* Tier 1: `sigma`
* Tier 2: `sigma + tier_step1`
* Tier 3: `sigma + tier_step2`
So **Tier 3 = “big bubble”**.
---
## 5) Optional VWAP bias filter
It computes VWAP correctly as:
* `vwapv = ta.vwap(hlc3)`
If enabled:
* buys only when `close >= vwap`
* sells only when `close <= vwap`
This is just a **trend/bias filter** to reduce counter-trend bubbles.
---
## 6) Plotting (how bubbles appear)
It places markers at:
* buys around `(close+low)/2` (lower-ish)
* sells around `(close+high)/2` (upper-ish)
And draws:
* small/medium/large circles (depending on tier)
* with optional INIT/ABS overlays (explained next)
---
## 7) “Initiative vs Absorbed” classification (the smart part)
Because Pine can’t see the future on the same bar, your script does a **delayed evaluation**:
* It waits `N = confirm_bars`
* Looks at what happened from the signal bar to the current bar
* Decides if price moved far enough in the intended direction
It uses:
* `hh_window = highest(high, N+1)`
* `ll_window = lowest(low, N+1)`
(these cover the last N+1 bars: from signal bar to now)
Then it measures follow-through:
* For a buy signal N bars ago:
`buy_move = hh_window - high[N]`
* For a sell signal N bars ago:
`sell_move = low[N] - ll_window`
It compares to an ATR-based threshold anchored to the signal bar:
* `thr_move_sig = ATR[N] * move_mult_atr`
If move > threshold → **INIT**
Else → **ABS**
Then it **plots back onto the original signal bar** using `offset=-N` so it visually marks the candle that caused it.
To make it obvious:
* **INIT** = circle
* **ABS** = X
This part is “accurate” in the sense that it’s purely **price-outcome based**.
---
## 8) Labels (optional)
If enabled, it prints labels on those large signals with:
* INIT/ABS
* the z-score at the signal bar
* and a “delta proxy” (`norm_buy - norm_sell`), not true delta
---
## In one sentence
The script flags **statistically extreme volume-pressure candles** (buy/sell proxy), and then classifies those extremes as **worked (initiative)** or **failed (absorbed)** based on **subsequent price movement** within `confirm_bars`.
Nota Keluaran
The script is a volume-anomaly “big trades” detector for futures that tries to (1) split each candle’s volume into a buy-pressure and sell-pressure estimate,
(2) flag statistically extreme candles (tiers),
and (3) optionally label those extremes as initiative (follow-through) vs absorbed (no follow-through) using a forward-style confirmation window.
Here’s what it does, piece by piece.
1) What it’s trying to detect
It’s not true “whale prints” or real bid/ask delta. It detects:
unusually large participation (volume anomaly)
with a directional guess (buy-ish vs sell-ish)
and then checks whether price continued after that anomaly
So it’s: “big participation + did it work?”
2) The “buy vs sell volume” estimate
For each candle, it builds a weight for buy and sell pressure:
close location within the candle:
close near high → more buy weight
close near low → more sell weight
body direction (close–open):
bullish body adds buy boost
bearish body adds sell boost
Then it computes:
raw_buy = volume * buy_weight
raw_sell = volume * sell_weight
This is an OHLC-based proxy for pressure, not real aggressor volume.
3) Normalization (makes it behave across sessions)
If enabled, it divides by ATR:
norm_buy = raw_buy / ATR
norm_sell = raw_sell / ATR
This helps a lot on futures because volume/volatility regimes differ between Asia/London/NY.
4) Statistical anomaly detection (z-score logic)
It calculates “what’s normal” using the last lookback bars, but uses [1] so the current bar doesn’t contaminate the stats (reduces flicker):
avg_buy = sma(norm_buy, lookback)[1]
std_buy = stdev(norm_buy, lookback)[1]
(and same for sell)
Then it computes z-scores:
z_buy = (norm_buy - avg_buy) / std_buy
z_sell = (norm_sell - avg_sell) / std_sell
If z-score crosses thresholds, it triggers tiers:
Tier 1: sigma
Tier 2: sigma + tier_step1
Tier 3: sigma + tier_step2
So Tier 3 = “big bubble”.
5) Optional VWAP bias filter
It computes VWAP correctly as:
vwapv = ta.vwap(hlc3)
If enabled:
buys only when close >= vwap
sells only when close <= vwap
This is just a trend/bias filter to reduce counter-trend bubbles.
6) Plotting (how bubbles appear)
It places markers at:
buys around (close+low)/2 (lower-ish)
sells around (close+high)/2 (upper-ish)
And draws:
small/medium/large circles (depending on tier)
with optional INIT/ABS overlays (explained next)
7) “Initiative vs Absorbed” classification (the smart part)
Because Pine can’t see the future on the same bar, your script does a delayed evaluation:
It waits N = confirm_bars
Looks at what happened from the signal bar to the current bar
Decides if price moved far enough in the intended direction
It uses:
hh_window = highest(high, N+1)
ll_window = lowest(low, N+1)
(these cover the last N+1 bars: from signal bar to now)
Then it measures follow-through:
For a buy signal N bars ago:
buy_move = hh_window - high[N]
For a sell signal N bars ago:
sell_move = low[N] - ll_window
It compares to an ATR-based threshold anchored to the signal bar:
thr_move_sig = ATR[N] * move_mult_atr
If move > threshold → INIT
Else → ABS
Then it plots back onto the original signal bar using offset=-N so it visually marks the candle that caused it.
To make it obvious:
INIT = circle
ABS = X
This part is “accurate” in the sense that it’s purely price-outcome based.
8) Labels (optional)
If enabled, it prints labels on those large signals with:
INIT/ABS
the z-score at the signal bar
and a “delta proxy” (norm_buy - norm_sell), not true delta
In one sentence:
The script flags statistically extreme volume-pressure candles (buy/sell proxy), and then classifies those extremes as worked (initiative) or failed (absorbed) based on subsequent price movement within confirm_bars.
Nota Keluaran
v2.4 Update – Classification & Alert ImprovementsMajor Changes
[]INIT / ABS classification is now permanently enabled and always applied to Tier 3 signals.
[]Removed duplicate Tier 3 base bubble — only the classified result (INIT ● or ABS ×) is displayed.- Alerts now trigger strictly on confirmed bars to eliminate phantom and intrabar alerts.
Alerts
Alert logic has been streamlined to only two conditions: Big Buy and Big Sell. Alerts now fire exclusively on confirmed signals and fully align with what is visually displayed on the chart.
Visual Improvements
Large signals now show only their classified outcome (INIT or ABS), reducing clutter and improving readability. Added new label modes: Hover (default), which displays dynamic tooltips when hovering over signals, and Always, which prints semi-transparent on-chart labels for classified Tier 3 signals.
General
Improved signal clarity, cleaner visual structure, enhanced stability, and reduced overall chart noise.
Nota Keluaran
Fix buggy chart change.Nota Keluaran
Big bubbles not appearing until classified as int / abs. Fixed.Skrip sumber terbuka
Dalam semangat TradingView sebenar, pencipta skrip ini telah menjadikannya sumber terbuka, jadi pedagang boleh menilai dan mengesahkan kefungsiannya. Terima kasih kepada penulis! Walaupuan anda boleh menggunakan secara percuma, ingat bahawa penerbitan semula kod ini tertakluk kepada Peraturan Dalaman.

Penafian
Maklumat dan penerbitan adalah tidak bertujuan, dan tidak membentuk, nasihat atau cadangan kewangan, pelaburan, dagangan atau jenis lain yang diberikan atau disahkan oleh TradingView. Baca lebih dalam Terma Penggunaan.
Skrip sumber terbuka
Dalam semangat TradingView sebenar, pencipta skrip ini telah menjadikannya sumber terbuka, jadi pedagang boleh menilai dan mengesahkan kefungsiannya. Terima kasih kepada penulis! Walaupuan anda boleh menggunakan secara percuma, ingat bahawa penerbitan semula kod ini tertakluk kepada Peraturan Dalaman.
Penafian
Maklumat dan penerbitan adalah tidak bertujuan, dan tidak membentuk, nasihat atau cadangan kewangan, pelaburan, dagangan atau jenis lain yang diberikan atau disahkan oleh TradingView. Baca lebih dalam Terma Penggunaan.