OPEN-SOURCE SCRIPT
PnL Target/Stop Calculator $100 - $2000
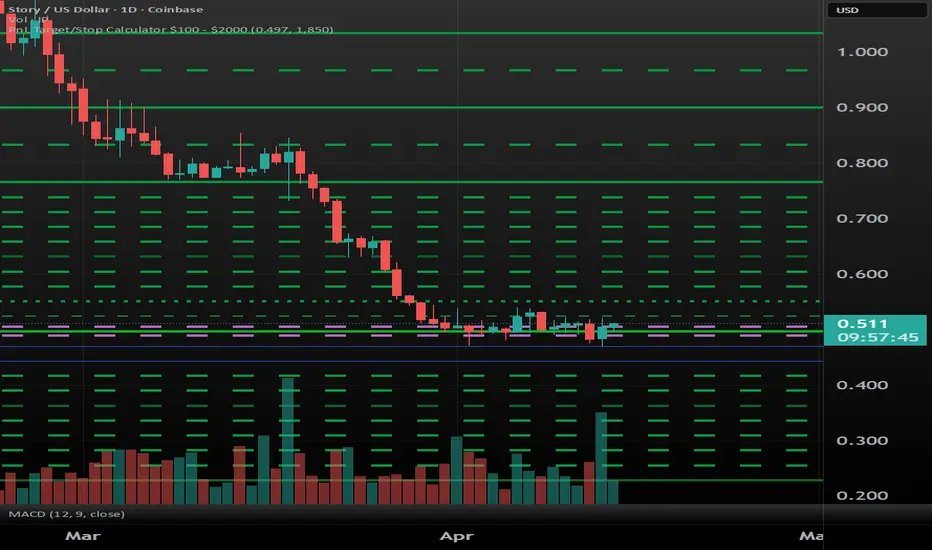
This tool plots gains and losses in $100 increments from $100 - $2000.
This can be used to find stop losses and targets based on PnL or to find the price where a specific loss or gain will occur at, and this is shown visually on chart with horizontal lines.
The user must define 2 values: The average entry price and how much is invested. This is done by going into the indicator's settings and clicking the Input tab.
Both entry and cash amount are used to determine where $100 increments of gain and loss are.
What's displayed?
- The brightest solid green line shows your entry.
- The skinniest dashed green line shows $100 loss/gain.
- The dotted green line shows $200 loss gain.
- It also contains a 1.6% stop, shown by the dashed purple lines.
- Solid green lines are $1000, $1500, and $2000.
After $1000 gain, the indicator shows gain in $250 increments up until $2000.
While PnL loss only goes up to $1000.
Here is how this is calculated:
$100 loss = [ (1-(100/cash)) * entry ].
$100 gain = [ (1+(100/cash)) * entry ]
$200 loss = [ (1-(200/cash)) * entry ].
$200 gain = [ (1+(200/cash)) * entry ]
...And so on.
To keep the horizontal lines after the indicator is removed, draw a horizontal ray or a horizontal line where the lines are drawn by the indicator and then remove the indicator after drawing the lines you wanted.
This can be used to find stop losses and targets based on PnL or to find the price where a specific loss or gain will occur at, and this is shown visually on chart with horizontal lines.
The user must define 2 values: The average entry price and how much is invested. This is done by going into the indicator's settings and clicking the Input tab.
Both entry and cash amount are used to determine where $100 increments of gain and loss are.
What's displayed?
- The brightest solid green line shows your entry.
- The skinniest dashed green line shows $100 loss/gain.
- The dotted green line shows $200 loss gain.
- It also contains a 1.6% stop, shown by the dashed purple lines.
- Solid green lines are $1000, $1500, and $2000.
After $1000 gain, the indicator shows gain in $250 increments up until $2000.
While PnL loss only goes up to $1000.
Here is how this is calculated:
$100 loss = [ (1-(100/cash)) * entry ].
$100 gain = [ (1+(100/cash)) * entry ]
$200 loss = [ (1-(200/cash)) * entry ].
$200 gain = [ (1+(200/cash)) * entry ]
...And so on.
To keep the horizontal lines after the indicator is removed, draw a horizontal ray or a horizontal line where the lines are drawn by the indicator and then remove the indicator after drawing the lines you wanted.
Skrip sumber terbuka
Dalam semangat TradingView sebenar, pencipta skrip ini telah menjadikannya sumber terbuka, jadi pedagang boleh menilai dan mengesahkan kefungsiannya. Terima kasih kepada penulis! Walaupuan anda boleh menggunakan secara percuma, ingat bahawa penerbitan semula kod ini tertakluk kepada Peraturan Dalaman.

Penafian
Maklumat dan penerbitan adalah tidak bertujuan, dan tidak membentuk, nasihat atau cadangan kewangan, pelaburan, dagangan atau jenis lain yang diberikan atau disahkan oleh TradingView. Baca lebih dalam Terma Penggunaan.
Skrip sumber terbuka
Dalam semangat TradingView sebenar, pencipta skrip ini telah menjadikannya sumber terbuka, jadi pedagang boleh menilai dan mengesahkan kefungsiannya. Terima kasih kepada penulis! Walaupuan anda boleh menggunakan secara percuma, ingat bahawa penerbitan semula kod ini tertakluk kepada Peraturan Dalaman.
Penafian
Maklumat dan penerbitan adalah tidak bertujuan, dan tidak membentuk, nasihat atau cadangan kewangan, pelaburan, dagangan atau jenis lain yang diberikan atau disahkan oleh TradingView. Baca lebih dalam Terma Penggunaan.