OPEN-SOURCE SCRIPT
Telah dikemas kini PO3 Matrix+ (M1D)
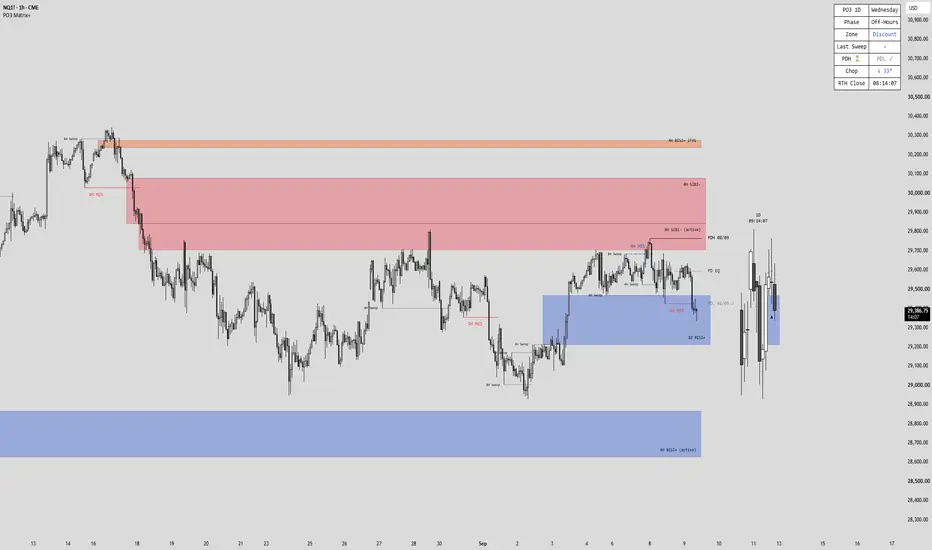
PO3 Matrix+ (M1D)
Projects the recent candles of a chosen higher timeframe as a compact candle matrix beside live price, then marks the liquidity events, structure and PD array context that develop on that timeframe — taken swings, structure shifts, fair value gaps, previous-day levels, and cross-market divergence. The intent is to read higher-timeframe conditions without leaving the execution chart, and to keep every drawn element sourced from the same data so nothing drifts out of step.
── HOW IT IS BUILT ──
The selected higher timeframe is pulled once, as a snapshot of its recent candles, and every element is drawn on the last bar from that one source. Dividers, high/low rails, quadrants, sweeps, gaps and structure all read the same array, so they cannot disagree with each other. The forming candle is accumulated from chart bars, so it updates live without repainting its history.
Level lines are origin-anchored: each one begins at the candle that actually printed the extreme, not at the bar where the level happened to be calculated. Derived midlines (equilibrium, the inner quartiles) have no originating candle, so they run from the period open instead.
── WHAT IT DRAWS ──
PO3 CANDLE MATRIX — the selected higher timeframe's recent candles, projected to the right of price with time dividers on the live chart and a per-candle high/low rail. A countdown above the block shows the timeframe in use and the time left on the forming candle. The PD array context is mirrored onto the block at its own horizontal scale, and each event carries a compact direction marker there, so the block reads as a standalone view of what that timeframe is showing.
CANDLE EQUILIBRIUM — the true 50 percent of each completed candle in the block, as a reference the following candle can retrace into.
CURRENT-RANGE QUADRANTS — the forming candle's high, 75 percent, equilibrium, 25 percent and low projected across price as a live premium and discount reference.
LIQUIDITY SWEEPS — only swing liquidity is marked. A level qualifies when it is a swing high or swing low that a later candle raids and then closes back inside: wick beyond, body back within. A candle that simply trades past its neighbour is not a sweep and is not marked.
SMT DIVERGENCE — the correlated market is read on the same higher-timeframe grid, so the two align candle for candle. A SMT is marked when your chart takes a swing but the peer fails to take its matching swing, meaning the move lacked cross-market participation. The peer auto-pairs across equity indices, precious metals and BTC against ETH, in matching contract sizes, and can be overridden with any symbol. It deliberately does not guess a peer for markets where the correlation is too loose for a divergence to mean anything; with no pairing, no SMT is drawn. A SMT is invalidated in real time once price trades back through the extreme that formed it, and is then either faded or removed.
MARKET STRUCTURE SHIFT — a true swing broken by a body close. A swing here means a level price actually turned at: a swing low sits at the change from a down candle to an up candle, a swing high at the change from an up candle to a down one. A low that merely sits under its neighbours while price kept running the same way is not a swing and is never used, which is what separates this from a plain pivot break. The first candle to CLOSE beyond the swing's full wick — body, not wick — marks the shift; later closes past the same level are continuation and are not marked. An optional setting requires a liquidity raid to precede the shift, for the classic sweep-then-shift sequencing: a buyside raid before a bearish shift, a sellside raid before a bullish one.
FAIR VALUE GAPS (BISI+ / SIBI-) — detected on the higher-timeframe snapshot, so they are multi-timeframe by construction. Only fully formed gaps are drawn; a gap still forming on the live candle is ignored until it completes. Each zone moves through four states: live, active, inverted, or spent. A gap closed clean through has inverted — the old support is now resistance, or the reverse — and it stays inverted, flipped and redrawn in the inversion colour, for as long as that break holds. No retest is required, because a retest is where the level gets traded rather than what makes it valid. Closing back through in the original direction takes the gap back; the zone is spent, and fades but stays on the chart as history rather than disappearing.
PREVIOUS-DAY LEVELS — previous high, low and equilibrium, drawn from session start and dimming once taken. Three definitions of the day are offered because they genuinely differ on futures: the symbol's own daily candle, midnight to midnight New York, or the regular-hours session only. Regular hours are taken from the instrument itself rather than a fixed clock, so index futures, metals and everything else each use their own session. The label carries the source date, so a level that is several days old after a weekend reads as intentional.
CONTEXT TABLE — day, AMD phase, forming-candle bias, premium or discount, higher-timeframe direction, last sweep, market structure shift, fair value gap, previous-day status, and a session-close countdown. SMT is drawn on the chart and the block but does not have its own table row.
── SETTINGS WORTH KNOWING ──
The higher timeframe must be above the chart timeframe; the script says so on the chart if it is not.
Session handling is read from the instrument, not hardcoded, so the regular-hours option and the session countdown are correct on index futures, metals and anything else without configuration. Instruments that trade around the clock have no regular session, and the countdown says so rather than inventing one.
Every drawn element can be turned on or off on its own, and the chart labels and the compact markers on the projected block are controlled separately, so the block can be kept clean while the chart stays annotated. Label size, colour, vertical clearance, which side of a line a label sits on, and the marker glyph style are all adjustable.
Fair value gap sensitivity is measured against the average range of the visible higher-timeframe candles, so it scales per instrument rather than being a fixed distance. Raise the minimum height and displacement to keep only the larger gaps.
Market structure shift has an optional displacement requirement, off by default. Turn it on if you want the shifting candle to also expand or leave a gap, which reduces how often it marks.
Sweeps, gaps and structure marks each have a maximum shown, so the chart stays contained rather than accumulating history indefinitely. Gap zones also declutter against each other: two translucent zones stacked on the same prices multiply into a solid block, so a zone overlapping one already drawn beyond an adjustable tolerance is skipped and the most recent gap in that price band is the one kept. The same idea applies to stacking: two same-direction zones separated by only a thin seam read as one inefficiency wearing two boxes, so the older one is removed and the newest kept. Zones facing opposite directions are never removed for sitting close together — they are genuinely different reads.
── NOTES ──
Detection runs on completed higher-timeframe candles. The forming candle updates live, but a gap or a structure mark is only considered once the candles that define it have closed.
SMT is not available in bar replay. Replay rewinds the chart symbol only, so the correlated symbol keeps returning its live data and the two grids no longer line up; the table reports Misaligned and no divergence is drawn. That is the alignment guard working, not a fault. Every other feature reads from the chart symbol and replays normally.
Everything drawn is context. There are no entry or exit instructions, no directional calls, and no performance claims of any kind. It reports what has happened on the higher timeframe.
This is a market-analysis tool, not financial advice. Past market behaviour does not indicate future results. Test any tool thoroughly and trade your own plan.


Projects the recent candles of a chosen higher timeframe as a compact candle matrix beside live price, then marks the liquidity events, structure and PD array context that develop on that timeframe — taken swings, structure shifts, fair value gaps, previous-day levels, and cross-market divergence. The intent is to read higher-timeframe conditions without leaving the execution chart, and to keep every drawn element sourced from the same data so nothing drifts out of step.
── HOW IT IS BUILT ──
The selected higher timeframe is pulled once, as a snapshot of its recent candles, and every element is drawn on the last bar from that one source. Dividers, high/low rails, quadrants, sweeps, gaps and structure all read the same array, so they cannot disagree with each other. The forming candle is accumulated from chart bars, so it updates live without repainting its history.
Level lines are origin-anchored: each one begins at the candle that actually printed the extreme, not at the bar where the level happened to be calculated. Derived midlines (equilibrium, the inner quartiles) have no originating candle, so they run from the period open instead.
── WHAT IT DRAWS ──
PO3 CANDLE MATRIX — the selected higher timeframe's recent candles, projected to the right of price with time dividers on the live chart and a per-candle high/low rail. A countdown above the block shows the timeframe in use and the time left on the forming candle. The PD array context is mirrored onto the block at its own horizontal scale, and each event carries a compact direction marker there, so the block reads as a standalone view of what that timeframe is showing.
CANDLE EQUILIBRIUM — the true 50 percent of each completed candle in the block, as a reference the following candle can retrace into.
CURRENT-RANGE QUADRANTS — the forming candle's high, 75 percent, equilibrium, 25 percent and low projected across price as a live premium and discount reference.
LIQUIDITY SWEEPS — only swing liquidity is marked. A level qualifies when it is a swing high or swing low that a later candle raids and then closes back inside: wick beyond, body back within. A candle that simply trades past its neighbour is not a sweep and is not marked.
SMT DIVERGENCE — the correlated market is read on the same higher-timeframe grid, so the two align candle for candle. A SMT is marked when your chart takes a swing but the peer fails to take its matching swing, meaning the move lacked cross-market participation. The peer auto-pairs across equity indices, precious metals and BTC against ETH, in matching contract sizes, and can be overridden with any symbol. It deliberately does not guess a peer for markets where the correlation is too loose for a divergence to mean anything; with no pairing, no SMT is drawn. A SMT is invalidated in real time once price trades back through the extreme that formed it, and is then either faded or removed.
MARKET STRUCTURE SHIFT — a true swing broken by a body close. A swing here means a level price actually turned at: a swing low sits at the change from a down candle to an up candle, a swing high at the change from an up candle to a down one. A low that merely sits under its neighbours while price kept running the same way is not a swing and is never used, which is what separates this from a plain pivot break. The first candle to CLOSE beyond the swing's full wick — body, not wick — marks the shift; later closes past the same level are continuation and are not marked. An optional setting requires a liquidity raid to precede the shift, for the classic sweep-then-shift sequencing: a buyside raid before a bearish shift, a sellside raid before a bullish one.
FAIR VALUE GAPS (BISI+ / SIBI-) — detected on the higher-timeframe snapshot, so they are multi-timeframe by construction. Only fully formed gaps are drawn; a gap still forming on the live candle is ignored until it completes. Each zone moves through four states: live, active, inverted, or spent. A gap closed clean through has inverted — the old support is now resistance, or the reverse — and it stays inverted, flipped and redrawn in the inversion colour, for as long as that break holds. No retest is required, because a retest is where the level gets traded rather than what makes it valid. Closing back through in the original direction takes the gap back; the zone is spent, and fades but stays on the chart as history rather than disappearing.
PREVIOUS-DAY LEVELS — previous high, low and equilibrium, drawn from session start and dimming once taken. Three definitions of the day are offered because they genuinely differ on futures: the symbol's own daily candle, midnight to midnight New York, or the regular-hours session only. Regular hours are taken from the instrument itself rather than a fixed clock, so index futures, metals and everything else each use their own session. The label carries the source date, so a level that is several days old after a weekend reads as intentional.
CONTEXT TABLE — day, AMD phase, forming-candle bias, premium or discount, higher-timeframe direction, last sweep, market structure shift, fair value gap, previous-day status, and a session-close countdown. SMT is drawn on the chart and the block but does not have its own table row.
── SETTINGS WORTH KNOWING ──
The higher timeframe must be above the chart timeframe; the script says so on the chart if it is not.
Session handling is read from the instrument, not hardcoded, so the regular-hours option and the session countdown are correct on index futures, metals and anything else without configuration. Instruments that trade around the clock have no regular session, and the countdown says so rather than inventing one.
Every drawn element can be turned on or off on its own, and the chart labels and the compact markers on the projected block are controlled separately, so the block can be kept clean while the chart stays annotated. Label size, colour, vertical clearance, which side of a line a label sits on, and the marker glyph style are all adjustable.
Fair value gap sensitivity is measured against the average range of the visible higher-timeframe candles, so it scales per instrument rather than being a fixed distance. Raise the minimum height and displacement to keep only the larger gaps.
Market structure shift has an optional displacement requirement, off by default. Turn it on if you want the shifting candle to also expand or leave a gap, which reduces how often it marks.
Sweeps, gaps and structure marks each have a maximum shown, so the chart stays contained rather than accumulating history indefinitely. Gap zones also declutter against each other: two translucent zones stacked on the same prices multiply into a solid block, so a zone overlapping one already drawn beyond an adjustable tolerance is skipped and the most recent gap in that price band is the one kept. The same idea applies to stacking: two same-direction zones separated by only a thin seam read as one inefficiency wearing two boxes, so the older one is removed and the newest kept. Zones facing opposite directions are never removed for sitting close together — they are genuinely different reads.
── NOTES ──
Detection runs on completed higher-timeframe candles. The forming candle updates live, but a gap or a structure mark is only considered once the candles that define it have closed.
SMT is not available in bar replay. Replay rewinds the chart symbol only, so the correlated symbol keeps returning its live data and the two grids no longer line up; the table reports Misaligned and no divergence is drawn. That is the alignment guard working, not a fault. Every other feature reads from the chart symbol and replays normally.
Everything drawn is context. There are no entry or exit instructions, no directional calls, and no performance claims of any kind. It reports what has happened on the higher timeframe.
This is a market-analysis tool, not financial advice. Past market behaviour does not indicate future results. Test any tool thoroughly and trade your own plan.
Nota Keluaran
UPDATELevel labels no longer clip their own lines. PDH, PDL, PD EQ and the current-range quadrant labels (H / 75% / EQ / 25% / L) were centred on the point their line ended at, which printed roughly half the text back over the line. They now anchor by their left edge: the text begins where the line ends and stays vertically centred on the price, so the level and its name read as one horizontal run. Transparent background — only the text shows.
Previous-day levels all end on the same vertical. PD EQ was drawn in a different coordinate space from PDH and PDL. On a clean intraday chart they landed together, but across a weekend or holiday gap the three stopped at visibly different points. All three now share one space, and their labels anchor to the same point.
MSS labels moved clear of the price action. An MSS label used to sit at the break end of its line, stacked above or below the level. For a bearish shift that is the busiest part of the chart — the level, the swing that formed it and every candle that ran into it are all there. The label now reads horizontally into the origin end of its line, vertically centred on the level and clear of it, on the same transparent background as every other level label here. The line runs away to the right with nothing printed over it.
Bullish colour is now blue. SMT bullish, MSS bullish, BISI+ zones and the dashboard bull colour all moved from green to blue. Bearish red is unchanged. The chart now reads red for premium and bearish, blue for everything else directional.
Dashboard condensed. Bias, Direction, MSS and FVG rows removed — all four are legible straight off the chart, since the projected candles carry bias and direction and the MSS lines and FVG zones are drawn where they happened. What remains is what the chart cannot show at a glance:
PO3 60m │ Thursday
Phase │ Distribution
Zone │ Premium
Last Sweep │ Buyside
PDH ✓ │ PDL ⏳
RTH Close │ 07:24:38
Noticeably faster, with identical output.
The sweep scan used to answer "was this the first level this candle took?" by rescanning every candle between the raider and the level — once per level, once per candle, rebuilt on every tick. It now carries the running extreme of that window forward instead. At the default 15 candles shown that is roughly 3,100 array reads per redraw down to 224. The detection result is unchanged; it was verified identical across 200,000 randomised candle sets.
The SMT peer is now read to 10 higher-timeframe candles rather than 20. Requesting a second instrument is by far the most expensive operation in the script, and with Max SMTs Shown at 4 a divergence nineteen candles back is history rather than context. No SMT is marked on candles older than the tenth; every other feature still reads all of them.
Switching SMT off now genuinely costs nothing. A data request runs whether or not its result is used, so turning the feature off previously cost the same as leaving it on. With SMT off the peer resolves to the chart's own symbol, so no second instrument is requested at all.
Detection, filters, sizing and the projected candle block are otherwise unchanged.
Nota Keluaran
SUSPENSION BLOCKS (SB+ / SB-)A new zone type on the higher-timeframe snapshot, drawn alongside the fair value gaps.
Where a fair value gap is a single seam of inefficiency, a suspension block is a run of them. Three consecutive same-direction candles whose BODIES gap at both joins — each candle opening beyond the previous one's close — leave the whole span between the first close and the third open suspended above or below the market, never traded back through.
The zone is drawn across that entire span rather than at one join.
Session and weekend breaks are excluded. A body gap across a market close is a calendar artefact rather than displacement, so any join whose candles are separated by more than one period of the selected timeframe is rejected.
A block is spent once a later candle trades into it past the chosen depth, measured from the far edge, and is then dropped. Minimum block height, mitigation depth, colours and how many of the most recent blocks stay drawn are all adjustable.
VOLUME IMBALANCES ABSORBED INTO GAPS
A volume imbalance — a body gap the wicks still bridge — sitting on either seam of a gap's displacement candle is part of the same imbalance. The zone now extends to that body edge rather than stopping at the wick gap, which on its own understates the region price left behind. The caption is unchanged; the zone is simply drawn at its true size. Optional.
CHOP ROW ON THE CONTEXT TABLE
A regime advisory reading the EMA-34 slope angle, normalised by the last 30 bars' range so it reads the same on any instrument. Flat tape reads CHOP.
It flags and never gates. Nothing else in the script keys off it, deliberately: a reversal setup — a judas, an accumulation — reads as chop immediately before it delivers, so a hard filter on this measure would remove the setups worth having. It is a stand-down advisory for continuation entries and nothing more. The angle threshold is adjustable, and the row can be switched off.
ZONE LABELS MOVED OFF CENTRE
Fair value gap captions previously sat in the middle of the zone, where the text straddled the gap it named. They now sit inside the zone at its live edge — a sellside imbalance captions at the top right, a buyside imbalance at the bottom right — so the middle of the zone stays clear and the caption reads against the boundary it belongs to. Placement follows how the gap was built, so an inverted zone keeps the corner its name implies.
ZONE BORDER MATCHES ITS FILL
Zone borders carried full opacity against a translucent body, which read as two separate objects stacked on the same prices. The border now takes the same transparency as the fill, so a zone reads as one region.
Nota Keluaran
Whats New ZONE MODE
The higher-timeframe snapshot now has one owner at a time. A new Zone Mode setting
chooses between Suspension Blocks and BISI / SIBI.
In Suspension Blocks mode the blocks are scanned first and claim their prices. A fair
value gap is drawn only where no block sits, so a block and a gap can never stack on the
same prices, on the chart or on the projected candle block. The gaps still fill in across
the rest of the chart. In BISI / SIBI mode only gaps are drawn and blocks are not looked
for at all. Each type keeps its own Show toggle, so Suspension Blocks mode with the gaps
switched off shows blocks alone.
SUSPENSION BLOCKS MIRRORED ONTO THE CANDLE BLOCK
Suspension blocks now draw across the projected candle block as well as the live chart,
condensed to the block's own horizontal scale and anchored to the first candle of the run,
exactly as the gaps already did. Each block carries a direction glyph on the candle block,
switchable in its own section. Both copies are painted from a single decision, so what
shows on the chart and what shows on the block cannot differ.
A RUN IS ONE BLOCK
A suspension block is a run of same-direction candles whose bodies gap at every join.
Three candles is the minimum, and a longer run is now drawn as one block from the first
candle's close to the last candle's open. Previously a four-candle run produced two
overlapping three-candle blocks.
SUSPENSION BLOCK INVERSION
Suspension blocks now share the gaps' four-state lifecycle: live, active, inverted and
spent. A block closed clean through has inverted. It turns the inversion colour and its
direction flips, on the chart and in the glyph. The name stays SB+ or SB-; the colour is
the state. Closing back through in the original direction takes the block back and it is
spent. Inversion is optional and on by default. Remove Touched and Keep Spent apply to
blocks and gaps alike.
ACTIVE AT DEPTH
A single Active At setting, shared by gaps and blocks and defaulting to 70 percent, sets
how far through a zone a wick must reach before the zone reads as active and goes dotted.
A wick that clips the near edge and closes away has touched the edge, not tested the zone,
and no longer dims it. Zero restores the old behaviour, where any wick into the zone
counted. Inversion is a close beyond the far edge and does not depend on this setting.
The Mitigated At setting in the Suspension Blocks section is replaced by this shared
one. A block that reaches the depth is now dimmed rather than removed, so it can still
invert; switch on Remove Touched Gaps to drop it at depth as before.
Nota Keluaran
SMT fixes.- A peer that cannot be reached no longer takes the indicator down. If the correlated symbol could not resolve on your chart — no data for it, a renamed contract, a typo in the override — the script raised a runtime error and every other feature died with it. The peer now returns nothing and no SMT is marked; the rest of the chart carries on.
- Metals pair properly. Gold to silver works in both directions and in matching sizes, and spot XAU pairs to XAG. The peer resolves on your chart's own exchange rather than a hardcoded one.
- The label is the peer's name alone. It read "H1 SMT vs BTCUSDT" on every divergence. The line's colour already says which way it reads and the dotted styling already says whether it is broken, so the label now just names the other instrument, smaller.
- Broken SMTs are removed by default. A divergence price has traded back through has been violated, and leaving it drawn is what turns a busy session into a wall of lines. This one changes an existing chart. Turn Remove Broken SMTs off to keep them drawn dotted and dimmed as before.
Market structure shift at three candles. With PO3 Candles Shown set to 3, the structure scan ran backwards over its own window and read the oldest candle in the block as if it were the newest, drawing a shift from unrelated data with no error shown. It now requires four candles, the same as the gap and suspension-block scans that walk the same sequence.
Nota Keluaran
A raided level must be a true swing. The sweep read took any PO3 candle that poked above its two neighbours as liquidity. It now has to be a swing by the same test the market structure shift already uses - a turn from an up candle to a down one for a high, the reverse for a low - so a candle that merely traded past its neighbours inside a run no longer counts as a pool, and the wick through it no longer prints as a sweep. Same change on the SMT read, which is fed from these sweeps. Nothing else changes.
Nota Keluaran
Mid and Low layers The 2022 Model's lower-timeframe engine now runs under the PO3 candles. Two more timeframes read their own candles on their own close and draw on the chart:
Swept swing pools
-Dotted from the bar that formed the level to the candle that raided it
True-swing market structure shifts -width 1, the low layer dashed so the two never read alike
Fair value gaps — the same four states and volume-imbalance absorption as the PO3 gaps, at most two live gaps per layer, with a faint edge so two layers stacked on the same prices read as two The PO3 layer stays senior. It draws first, its gaps claim their price bands, and a level it marks is not marked again one step down. Each layer has its own sweep, MSS and gap switches.
Auto timeframes A new Timeframes mode at the top of the settings, Auto or Manual, Auto by default. Auto picks all three timeframes from the chart:
1m — 60 / 15 / 5
5m — 240 / 60 / 15
15m and 30m — D / 240 / 60
1H — D / 8H / 4H
4H — W / D / 8H
daily — M / W / 3D Manual uses the three timeframe pickers, which stay greyed out until it is chosen.
Alerts
Liquidity-sweep and MSS alerts on all three timeframes, on the confirmed candle only, each event once.
Sweep lines
Every dotted sweep line on the chart now draws at width 1. The Width setting applies to the solid copy on the candle block only.
Nothing else changes.
Nota Keluaran
Source code correctionNota Keluaran
Every market structure shift now carries its Smart Money Reversal state. A Smart Money Reversal is a raid that failed: a wick takes a true swing extreme, the candle closes back inside, and within a few candles price displaces the other way. Each MSS is tagged with a tick when a reversal sits behind it and a cross when none does. The reversal can come from the shift's own layer or any higher one, so a 5m shift after a 1H raid reads as confirmed. The tag never hides a shift and never blocks an alert.
The reversal is on the dashboard and in the alert payload.
A new SMR row shows the most recent reversal on any layer, with its direction, timeframe and size in points. MSS alerts now include the reversal behind the shift, or state that there was none. The displacement threshold can be measured in points or as a share of the daily range.
Shorter MSS labels.
A shift label now reads "5m MSS ✓" or "5m MSS ✗". Hover the label for the full reading, including the reversal's timeframe and size. The MSS Label Length setting switches back to the full text on the chart.
MSS labels sit at the origin candle.
The label now sits below a broken low and above a broken high, at the candle that formed the swing, so it stays clear of price. Along the Line restores the previous placement.
SMT labels sit at the sweep candle.
A SMT name now sits outside the extreme that made the divergence, above the high of a bearish SMT and below the low of a bullish SMT. It no longer sits in the middle of the diagonal line, where it was cut off when zooming in. Along the Line restores the previous placement.
Sweep labels are shortened to an x. A sweep now reads "1H x" rather than "1H Sweep", which keeps busy sessions readable.
The candle close timer reads in days. A weekly candle now counts down as 4d 10h 48m rather than 106:48:18, under a day as 10h 48m and under an hour as 48m 18s. The Timer Format setting switches back to hours, minutes and seconds.
Cleaner defaults.
A new chart opens with dividers, per-candle high/low lines and quadrant levels off, BISI / SIBI zones, two gaps shown with touched gaps removed, one gap per lower layer, displacement required on shifts at 0.5× the average HTF range, and labels on their lines. Previous-day level labels are smaller, and those levels extend four bars. Charts that already have the indicator keep their saved settings.
Skrip sumber terbuka
Dalam semangat TradingView sebenar, pencipta skrip ini telah menjadikannya sumber terbuka, jadi pedagang boleh menilai dan mengesahkan kefungsiannya. Terima kasih kepada penulis! Walaupuan anda boleh menggunakan secara percuma, ingat bahawa penerbitan semula kod ini tertakluk kepada Peraturan Dalaman.

Penafian
Maklumat dan penerbitan adalah tidak bertujuan, dan tidak membentuk, nasihat atau cadangan kewangan, pelaburan, dagangan atau jenis lain yang diberikan atau disahkan oleh TradingView. Baca lebih dalam Terma Penggunaan.
Skrip sumber terbuka
Dalam semangat TradingView sebenar, pencipta skrip ini telah menjadikannya sumber terbuka, jadi pedagang boleh menilai dan mengesahkan kefungsiannya. Terima kasih kepada penulis! Walaupuan anda boleh menggunakan secara percuma, ingat bahawa penerbitan semula kod ini tertakluk kepada Peraturan Dalaman.
Penafian
Maklumat dan penerbitan adalah tidak bertujuan, dan tidak membentuk, nasihat atau cadangan kewangan, pelaburan, dagangan atau jenis lain yang diberikan atau disahkan oleh TradingView. Baca lebih dalam Terma Penggunaan.