Confluence Dual Oscillator
█ OVERVIEW
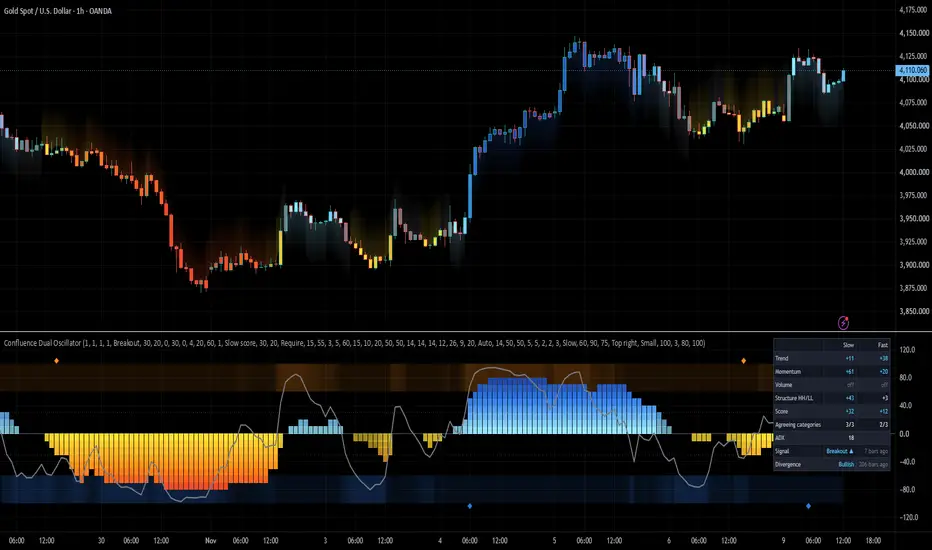
Confluence Dual Oscillator combines four categories of technical analysis into a single reading: Trend, Momentum, Volume and Market Structure. From these categories it calculates two scores on a scale from −100 to +100:
• the SLOW score – describes the direction and strength of the trend,
• the FAST score – helps with the timing of entries.
The indicator is built on a simple premise. A single indicator, such as RSI or MACD, shows only one slice of the market and often gives conflicting readings. When several independent categories point in the same direction, the move has broader support: trend, momentum, capital flow and the structure of highs and lows all tell the same story. The indicator shows how far these categories agree, without the need to plot each of them on the chart separately.
By default, the slow score is drawn as blocks (10 blocks per side, 1 block = 10 points) and the fast score as a line. On this basis the indicator generates three types of events:
• trend signals ◆ – entries in the direction of the slow score,
• counter-trend signals ▲▼ – the fast score returns from the overbought or oversold zone,
• divergences – between price and the fast score, optionally combined with counter-trend signals into B / S labels.
The picture is completed by a table with the readings of all categories, bar coloring, a glow on the price chart and alerts.
█ CONCEPTS
Four categories
Each category answers a different question about the market. The slow and fast scores use the same categories, but different components: the slow score answers the question "what is the trend?", the fast score answers "is this a good moment to enter?".
Trend – which way is the market moving and is that direction stable?
This category determines the basic direction of the market.
• Slow: the alignment of the fast and slow EMA (20 / 50 by default), the dominance of +DI over −DI and the direction of the linear regression slope. These are three independent ways of judging direction. When they agree, the trend is clear.
• Fast: the distance of price from the fast EMA. It shows whether price is currently pulling back towards the average (a pullback) or moving away from it (an extended move).
Momentum – how strong is the move and is it accelerating or fading?
This category measures the force behind the move. A trend can continue while losing strength, and this is where that shows up first.
• Slow: the price change over the last N bars (20 by default), i.e. the momentum of the whole wave.
• Fast: RSI and the MACD histogram. They show acceleration and deceleration of the move. The MACD histogram is often the first to signal fading momentum.
Volume – is the price move backed by capital flow?
This category checks whether real money stands behind the move. A move without volume produces a weaker score, so the indicator generates fewer signals on "hollow" breakouts.
• Slow: longer-period Chaikin Money Flow and OBV relative to its average. They show whether accumulation (bars closing near their highs on strong volume) or distribution dominates over the longer period.
• Fast: shorter-period Chaikin Money Flow, i.e. the current capital flow.
Structure – is the market making higher highs and lows or lower ones, and where is price relative to the last swing?
This category describes the market the way a chart reader sees it: through the sequence of highs and lows.
• Slow: the sequence of major swing highs and lows (HH / HL in an uptrend, LH / LL in a downtrend) and the position of price relative to the last major swing. Price moving above the swing high or below the swing low (break of structure) shifts the score strongly.
• Fast: the position of price within the most recent minor swing. It shows whether price is near the upper or the lower edge of the current move.
Normalization
Each component is scaled to a range of −1 to +1 relative to its own typical magnitude over the last 100 bars. This makes RSI, MACD, volume and price distances comparable with one another, and keeps the scores consistent across markets and timeframes. Price distances are expressed in ATR.
Weights and category agreement
The score is a weighted average of the categories. Each category has an adjustable weight. A weight of 0 excludes it from the score, a higher weight increases its influence. The indicator also counts how many categories clearly point in a given direction. When the categories disagree, the blocks are dimmed: full color means agreement, a faded color means the score is driven by only one or two categories.
Trend signals ◆
Two modes are available:
• Pullback: the trend is in place (slow score beyond the trend threshold), price pulls back (fast score drops below the pullback depth), then the pullback ends (fast score crosses back through the entry trigger). Each pullback allows at most one signal. The entry usually comes earlier and at a better price, but no pullback means no signal.
• Breakout (default): a signal appears when the slow score crosses the breakout level. The next signal in the same direction is allowed only after the score returns to the set re-arm level, which prevents a series of signals while the score oscillates around the threshold.
In both modes a minimum number of agreeing categories is required (2 by default). An ADX filter can optionally be enabled. The zone filter blocks a Long while the fast score is already overbought and a Short while it is oversold, so you do not enter an overextended move.
Counter-trend signals ▲▼
A signal appears when the fast score leaves the overbought zone (Sell) or the oversold zone (Buy), ±60 by default. You can require the score to stay in the zone for a minimum number of bars. A filter blocks signals against a strong trend:
• Slow score: Sell is blocked while the slow score is strongly up, Buy while it is strongly down,
• ADX: signals pass only when ADX is low, i.e. in a range,
• None: no filter.
Blocked signals can be shown in a faded color, so you can see what the filter removes.
Divergences
The indicator looks for divergences between price and the fast score. A bullish divergence is a lower low in price with a higher low in the score; a bearish divergence is a higher high in price with a lower high in the score. To reject noise, the pair of highs (lows) must meet several conditions: suitable spacing, a clear retrace of the score between them, a minimum height difference, the first point inside the zone, the second point on the correct side of zero, and a divergence line that the score does not cross.
Combining with counter-trend signals (Divergence link):
• Ignore: signals and divergences work independently,
• Mark: when a signal and a divergence in the same direction occur close together, an additional B or S label appears,
• Require (default): only divergence-confirmed signals (B / S) are shown on the chart.
A divergence-confirmed signal can bypass the filter, because divergences often form while the trend is still strong.
Signals on bar close
By default, signals, divergences and alerts appear only after the bar closes, so they never disappear intrabar. Blocks, line and table update in real time.
█ FEATURES
• Two scores (slow and fast) calculated from the same four categories.
• Component normalization that makes the scores comparable across markets and timeframes.
• Adjustable weight for each category.
• Trend signals ◆ in Pullback or Breakout mode, with category agreement, ADX and zone filters.
• Counter-trend signals ▲▼ with a slow score or ADX filter and a preview of blocked signals.
• Divergences with a set of quality filters and line drawing.
• B / S labels – counter-trend signals confirmed by a divergence.
• Auto volume mode that skips volume on Forex and CFDs.
• Choice of which score is shown as blocks and which as a line.
• Block dimming when category agreement is weak.
• Overbought / oversold zones with dynamic intensity.
• Bar coloring in the color of the highest lit block.
• Glow on the price chart: below the bars when bulls dominate, above the bars when bears dominate.
• Table: category readings for both scores, agreement, ADX, last signal and last divergence.
• Configurable block colors (from weak to strong).
• A single alert covering all selected signal types.
█ APPLICATIONS
Assessing trend direction and strength
The slow score blocks show which way the market leans and how strongly. Full-color blocks mean most categories agree; faded blocks mean the trend rests on a narrower base.
Trend-following entries
In Pullback mode the indicator waits for a pullback within an established trend and signals when it ends. In Breakout mode it catches the start of a strong move.
Spotting turning points
Counter-trend signals and divergences point to places where the move is losing momentum. B / S labels combine both conditions.
Checking the components
The table lets you see at a glance which category drives the score and which contradicts it, e.g. a strong trend with fading volume.
Example of use
Confluence Dual Oscillator is best treated as a tool for assessing context rather than an automatic trading system. Before making a decision it is worth taking into account:
• the direction and strength of the slow score,
• category agreement (full or faded blocks),
• the position of the fast score relative to the zones,
• the presence of divergences,
• the position of price relative to significant support and resistance levels – e.g. a Long signal right below strong resistance is risky, because price may bounce off it. It is better to wait for a break of the resistance, or for a retest of it from above, and only then enter. The same applies to a Short right above support,
• the broader context and higher timeframes.
█ NOTES
• Signals are not recommendations. Agreement across many categories does not guarantee that the move will continue.
• Structure highs and lows and divergences are confirmed with a delay equal to the number of confirmation bars, but do not change afterwards.
• Smoothing reduces the number of false signals, but delays all signals.
• With "Signals on bar close only" disabled, a signal may appear during a bar and disappear before it closes.
• Disabling a category (weight 0 or volume off) reduces the number of active categories. The agreement requirement then adjusts to their number.
• On instruments without volume data, and in Auto mode also on Forex and CFDs, the Volume category is disabled and the table shows "off".
Confluence Dual Oscillator combines four categories of technical analysis into a single reading: Trend, Momentum, Volume and Market Structure. From these categories it calculates two scores on a scale from −100 to +100:
• the SLOW score – describes the direction and strength of the trend,
• the FAST score – helps with the timing of entries.
The indicator is built on a simple premise. A single indicator, such as RSI or MACD, shows only one slice of the market and often gives conflicting readings. When several independent categories point in the same direction, the move has broader support: trend, momentum, capital flow and the structure of highs and lows all tell the same story. The indicator shows how far these categories agree, without the need to plot each of them on the chart separately.
By default, the slow score is drawn as blocks (10 blocks per side, 1 block = 10 points) and the fast score as a line. On this basis the indicator generates three types of events:
• trend signals ◆ – entries in the direction of the slow score,
• counter-trend signals ▲▼ – the fast score returns from the overbought or oversold zone,
• divergences – between price and the fast score, optionally combined with counter-trend signals into B / S labels.
The picture is completed by a table with the readings of all categories, bar coloring, a glow on the price chart and alerts.
█ CONCEPTS
Four categories
Each category answers a different question about the market. The slow and fast scores use the same categories, but different components: the slow score answers the question "what is the trend?", the fast score answers "is this a good moment to enter?".
Trend – which way is the market moving and is that direction stable?
This category determines the basic direction of the market.
• Slow: the alignment of the fast and slow EMA (20 / 50 by default), the dominance of +DI over −DI and the direction of the linear regression slope. These are three independent ways of judging direction. When they agree, the trend is clear.
• Fast: the distance of price from the fast EMA. It shows whether price is currently pulling back towards the average (a pullback) or moving away from it (an extended move).
Momentum – how strong is the move and is it accelerating or fading?
This category measures the force behind the move. A trend can continue while losing strength, and this is where that shows up first.
• Slow: the price change over the last N bars (20 by default), i.e. the momentum of the whole wave.
• Fast: RSI and the MACD histogram. They show acceleration and deceleration of the move. The MACD histogram is often the first to signal fading momentum.
Volume – is the price move backed by capital flow?
This category checks whether real money stands behind the move. A move without volume produces a weaker score, so the indicator generates fewer signals on "hollow" breakouts.
• Slow: longer-period Chaikin Money Flow and OBV relative to its average. They show whether accumulation (bars closing near their highs on strong volume) or distribution dominates over the longer period.
• Fast: shorter-period Chaikin Money Flow, i.e. the current capital flow.
Structure – is the market making higher highs and lows or lower ones, and where is price relative to the last swing?
This category describes the market the way a chart reader sees it: through the sequence of highs and lows.
• Slow: the sequence of major swing highs and lows (HH / HL in an uptrend, LH / LL in a downtrend) and the position of price relative to the last major swing. Price moving above the swing high or below the swing low (break of structure) shifts the score strongly.
• Fast: the position of price within the most recent minor swing. It shows whether price is near the upper or the lower edge of the current move.
Normalization
Each component is scaled to a range of −1 to +1 relative to its own typical magnitude over the last 100 bars. This makes RSI, MACD, volume and price distances comparable with one another, and keeps the scores consistent across markets and timeframes. Price distances are expressed in ATR.
Weights and category agreement
The score is a weighted average of the categories. Each category has an adjustable weight. A weight of 0 excludes it from the score, a higher weight increases its influence. The indicator also counts how many categories clearly point in a given direction. When the categories disagree, the blocks are dimmed: full color means agreement, a faded color means the score is driven by only one or two categories.
Trend signals ◆
Two modes are available:
• Pullback: the trend is in place (slow score beyond the trend threshold), price pulls back (fast score drops below the pullback depth), then the pullback ends (fast score crosses back through the entry trigger). Each pullback allows at most one signal. The entry usually comes earlier and at a better price, but no pullback means no signal.
• Breakout (default): a signal appears when the slow score crosses the breakout level. The next signal in the same direction is allowed only after the score returns to the set re-arm level, which prevents a series of signals while the score oscillates around the threshold.
In both modes a minimum number of agreeing categories is required (2 by default). An ADX filter can optionally be enabled. The zone filter blocks a Long while the fast score is already overbought and a Short while it is oversold, so you do not enter an overextended move.
Counter-trend signals ▲▼
A signal appears when the fast score leaves the overbought zone (Sell) or the oversold zone (Buy), ±60 by default. You can require the score to stay in the zone for a minimum number of bars. A filter blocks signals against a strong trend:
• Slow score: Sell is blocked while the slow score is strongly up, Buy while it is strongly down,
• ADX: signals pass only when ADX is low, i.e. in a range,
• None: no filter.
Blocked signals can be shown in a faded color, so you can see what the filter removes.
Divergences
The indicator looks for divergences between price and the fast score. A bullish divergence is a lower low in price with a higher low in the score; a bearish divergence is a higher high in price with a lower high in the score. To reject noise, the pair of highs (lows) must meet several conditions: suitable spacing, a clear retrace of the score between them, a minimum height difference, the first point inside the zone, the second point on the correct side of zero, and a divergence line that the score does not cross.
Combining with counter-trend signals (Divergence link):
• Ignore: signals and divergences work independently,
• Mark: when a signal and a divergence in the same direction occur close together, an additional B or S label appears,
• Require (default): only divergence-confirmed signals (B / S) are shown on the chart.
A divergence-confirmed signal can bypass the filter, because divergences often form while the trend is still strong.
Signals on bar close
By default, signals, divergences and alerts appear only after the bar closes, so they never disappear intrabar. Blocks, line and table update in real time.
█ FEATURES
• Two scores (slow and fast) calculated from the same four categories.
• Component normalization that makes the scores comparable across markets and timeframes.
• Adjustable weight for each category.
• Trend signals ◆ in Pullback or Breakout mode, with category agreement, ADX and zone filters.
• Counter-trend signals ▲▼ with a slow score or ADX filter and a preview of blocked signals.
• Divergences with a set of quality filters and line drawing.
• B / S labels – counter-trend signals confirmed by a divergence.
• Auto volume mode that skips volume on Forex and CFDs.
• Choice of which score is shown as blocks and which as a line.
• Block dimming when category agreement is weak.
• Overbought / oversold zones with dynamic intensity.
• Bar coloring in the color of the highest lit block.
• Glow on the price chart: below the bars when bulls dominate, above the bars when bears dominate.
• Table: category readings for both scores, agreement, ADX, last signal and last divergence.
• Configurable block colors (from weak to strong).
• A single alert covering all selected signal types.
█ APPLICATIONS
Assessing trend direction and strength
The slow score blocks show which way the market leans and how strongly. Full-color blocks mean most categories agree; faded blocks mean the trend rests on a narrower base.
Trend-following entries
In Pullback mode the indicator waits for a pullback within an established trend and signals when it ends. In Breakout mode it catches the start of a strong move.
Spotting turning points
Counter-trend signals and divergences point to places where the move is losing momentum. B / S labels combine both conditions.
Checking the components
The table lets you see at a glance which category drives the score and which contradicts it, e.g. a strong trend with fading volume.
Example of use
Confluence Dual Oscillator is best treated as a tool for assessing context rather than an automatic trading system. Before making a decision it is worth taking into account:
• the direction and strength of the slow score,
• category agreement (full or faded blocks),
• the position of the fast score relative to the zones,
• the presence of divergences,
• the position of price relative to significant support and resistance levels – e.g. a Long signal right below strong resistance is risky, because price may bounce off it. It is better to wait for a break of the resistance, or for a retest of it from above, and only then enter. The same applies to a Short right above support,
• the broader context and higher timeframes.
█ NOTES
• Signals are not recommendations. Agreement across many categories does not guarantee that the move will continue.
• Structure highs and lows and divergences are confirmed with a delay equal to the number of confirmation bars, but do not change afterwards.
• Smoothing reduces the number of false signals, but delays all signals.
• With "Signals on bar close only" disabled, a signal may appear during a bar and disappear before it closes.
• Disabling a category (weight 0 or volume off) reduces the number of active categories. The agreement requirement then adjusts to their number.
• On instruments without volume data, and in Auto mode also on Forex and CFDs, the Volume category is disabled and the table shows "off".

Penafian
Maklumat dan penerbitan adalah tidak bertujuan, dan tidak membentuk, nasihat atau cadangan kewangan, pelaburan, dagangan atau jenis lain yang diberikan atau disahkan oleh TradingView. Baca lebih dalam Terma Penggunaan.
Penafian
Maklumat dan penerbitan adalah tidak bertujuan, dan tidak membentuk, nasihat atau cadangan kewangan, pelaburan, dagangan atau jenis lain yang diberikan atau disahkan oleh TradingView. Baca lebih dalam Terma Penggunaan.