OPEN-SOURCE SCRIPT
Market Internals Dashboard ADD TICK VOLD
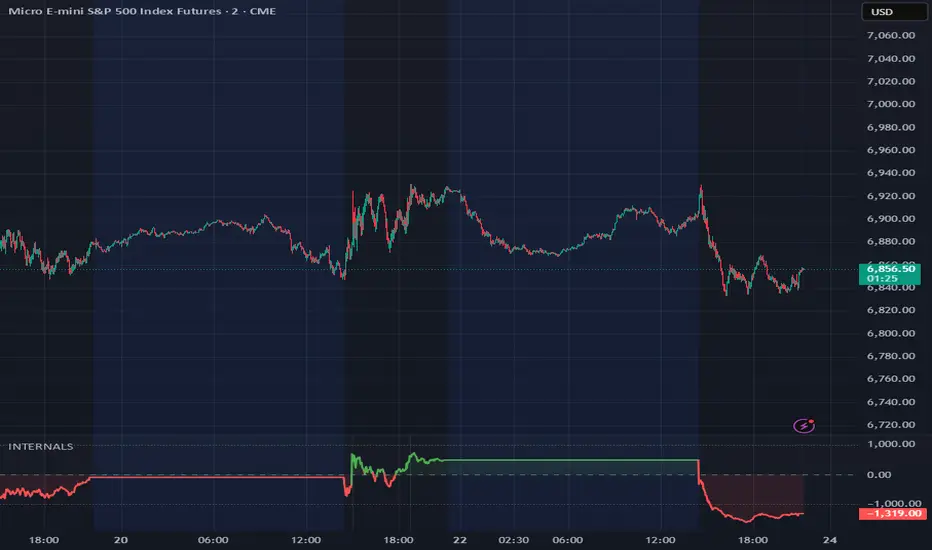
Real-time NYSE Market Internals combining Advance/Decline, Up/Down Volume, and TICK in one lower study. See breadth, volume flow, and panic/exhaustion at a glance.
📊 Market Internals Dashboard — See What the Market is REALLY Doing
Most retail traders only watch price. Institutions watch INTERNALS. This indicator puts the three most important NYSE breadth indicators into one clean lower-pane study so you can read market health in seconds.
━━━━━━━━━━━━━━━━━━━━━━━━━
🔍 WHAT IT SHOWS:
1️⃣ AADD (Advance/Decline Line) — Main Plot
• Green line = more stocks advancing (bullish breadth)
• Red line = more stocks declining (bearish breadth)
• Dotted lines at +1000 / -1000 mark extreme readings
• Zero line shows neutral — crossovers here are key signals
2️⃣ VVOLD (Up/Down Volume) — Gradient Cloud Fill
• Green shading = more volume flowing into advancing stocks
• Red shading = more volume flowing into declining stocks
• This confirms whether money is backing the move or fading it
3️⃣ TTICK (NYSE Tick) — Background Highlights
• Green background flash = TTICK above +1000 (extreme buying pressure)
• Red background flash = TTICK below -1000 (extreme selling / panic)
• No highlight = normal range, no extreme pressure
━━━━━━━━━━━━━━━━━━━━━━━━━
📈 HOW TO USE:
✅ BULLISH Setup (Look for Longs):
• AADD green and rising above zero
• Green cloud fill (VVOLD confirming volume flow)
• Green background flashes (TTICK extremes)
• All three aligned = strong institutional buying
✅ BEARISH Setup (Look for Shorts):
• AADD red and falling below zero
• Red cloud fill (VVOLD confirming selling volume)
• Red background flashes (TTICK panic prints)
• All three aligned = strong institutional selling
⚠️ MIXED / CHOPPY (Stay Cautious):
• AADD near zero, flipping back and forth
• Cloud color changing frequently
• No TTICK extremes firing
• Internals are indecisive = reduce size or sit on hands
━━━━━━━━━━━━━━━━━━━━━━━━━
💡 PRO TIPS:
• Use this alongside your price chart — internals CONFIRM or DENY what price is showing
• If price is breaking out but internals are weak/red → likely a false breakout
• If price is pulling back but internals stay green → likely a dip buy opportunity
• TTICK extremes (background flashes) are great for scalp timing on SPY/ES/NQ
• Watch for AADD crossing zero with volume confirmation — that's a momentum shift
• Best on 1-min to 15-min charts for intraday trading
━━━━━━━━━━━━━━━━━━━━━━━━━
🎯 BEST FOR:
• SPY / ES / NQ day traders
• Opening Range Breakout confirmation
• Scalpers timing entries with TTICK extremes
• Swing traders confirming trend days vs. chop days
• Anyone who wants to trade WITH institutions, not against them
━━━━━━━━━━━━━━━━━━━━━━━━━
⚙️ DATA SOURCES:
• USI:ADD — NYSE Advance/Decline Issues
• USI:VOLD — NYSE Up/Down Volume
• USI:TICK — NYSE Tick Index
All real-time NYSE breadth data. No simulations.
━━━━━━━━━━━━━━━━━━━━━━━━━
Built by theTRADINGDECK — "Stack the deck in your favor." 📈
📊 Market Internals Dashboard — See What the Market is REALLY Doing
Most retail traders only watch price. Institutions watch INTERNALS. This indicator puts the three most important NYSE breadth indicators into one clean lower-pane study so you can read market health in seconds.
━━━━━━━━━━━━━━━━━━━━━━━━━
🔍 WHAT IT SHOWS:
1️⃣ AADD (Advance/Decline Line) — Main Plot
• Green line = more stocks advancing (bullish breadth)
• Red line = more stocks declining (bearish breadth)
• Dotted lines at +1000 / -1000 mark extreme readings
• Zero line shows neutral — crossovers here are key signals
2️⃣ VVOLD (Up/Down Volume) — Gradient Cloud Fill
• Green shading = more volume flowing into advancing stocks
• Red shading = more volume flowing into declining stocks
• This confirms whether money is backing the move or fading it
3️⃣ TTICK (NYSE Tick) — Background Highlights
• Green background flash = TTICK above +1000 (extreme buying pressure)
• Red background flash = TTICK below -1000 (extreme selling / panic)
• No highlight = normal range, no extreme pressure
━━━━━━━━━━━━━━━━━━━━━━━━━
📈 HOW TO USE:
✅ BULLISH Setup (Look for Longs):
• AADD green and rising above zero
• Green cloud fill (VVOLD confirming volume flow)
• Green background flashes (TTICK extremes)
• All three aligned = strong institutional buying
✅ BEARISH Setup (Look for Shorts):
• AADD red and falling below zero
• Red cloud fill (VVOLD confirming selling volume)
• Red background flashes (TTICK panic prints)
• All three aligned = strong institutional selling
⚠️ MIXED / CHOPPY (Stay Cautious):
• AADD near zero, flipping back and forth
• Cloud color changing frequently
• No TTICK extremes firing
• Internals are indecisive = reduce size or sit on hands
━━━━━━━━━━━━━━━━━━━━━━━━━
💡 PRO TIPS:
• Use this alongside your price chart — internals CONFIRM or DENY what price is showing
• If price is breaking out but internals are weak/red → likely a false breakout
• If price is pulling back but internals stay green → likely a dip buy opportunity
• TTICK extremes (background flashes) are great for scalp timing on SPY/ES/NQ
• Watch for AADD crossing zero with volume confirmation — that's a momentum shift
• Best on 1-min to 15-min charts for intraday trading
━━━━━━━━━━━━━━━━━━━━━━━━━
🎯 BEST FOR:
• SPY / ES / NQ day traders
• Opening Range Breakout confirmation
• Scalpers timing entries with TTICK extremes
• Swing traders confirming trend days vs. chop days
• Anyone who wants to trade WITH institutions, not against them
━━━━━━━━━━━━━━━━━━━━━━━━━
⚙️ DATA SOURCES:
• USI:ADD — NYSE Advance/Decline Issues
• USI:VOLD — NYSE Up/Down Volume
• USI:TICK — NYSE Tick Index
All real-time NYSE breadth data. No simulations.
━━━━━━━━━━━━━━━━━━━━━━━━━
Built by theTRADINGDECK — "Stack the deck in your favor." 📈
Skrip sumber terbuka
Dalam semangat TradingView sebenar, pencipta skrip ini telah menjadikannya sumber terbuka, jadi pedagang boleh menilai dan mengesahkan kefungsiannya. Terima kasih kepada penulis! Walaupuan anda boleh menggunakan secara percuma, ingat bahawa penerbitan semula kod ini tertakluk kepada Peraturan Dalaman.

Penafian
Maklumat dan penerbitan adalah tidak bertujuan, dan tidak membentuk, nasihat atau cadangan kewangan, pelaburan, dagangan atau jenis lain yang diberikan atau disahkan oleh TradingView. Baca lebih dalam Terma Penggunaan.
Skrip sumber terbuka
Dalam semangat TradingView sebenar, pencipta skrip ini telah menjadikannya sumber terbuka, jadi pedagang boleh menilai dan mengesahkan kefungsiannya. Terima kasih kepada penulis! Walaupuan anda boleh menggunakan secara percuma, ingat bahawa penerbitan semula kod ini tertakluk kepada Peraturan Dalaman.
Penafian
Maklumat dan penerbitan adalah tidak bertujuan, dan tidak membentuk, nasihat atau cadangan kewangan, pelaburan, dagangan atau jenis lain yang diberikan atau disahkan oleh TradingView. Baca lebih dalam Terma Penggunaan.