OPEN-SOURCE SCRIPT
Telah dikemas kini [blackcat] L2 Ehlers Optimum Predictor
Level: 2
Background
John F. Ehlers introuced Optimum Predictor in his "Rocket Science for Traders" chapter 20 on 2001.
Function
As we have seen before, the majority of the code involves the computation of the period using the Homodyne Discriminator algorithm. Once the period has
been computed, the Optimum Predictor is found in just a few lines of code. First, the minimum-length Hilbert Transformer is used to compute the Detrender2 value from the prices that have been smoothed by the 4-bar Weighted Moving Average (WMA). Detrender2 is smoothed in the 4-bar WMA to produce Smooth2. The alpha of the EMA is computed from the computed period, and the EMA of Smooth2 is taken using that alpha and is called the DetrendEMA. The difference between Smooth2 and the
DetrendEMA is multiplied by 1.4 to produce the Predict phasor. Finally, the Smooth2 and Predict phasors are plotted as indicators.
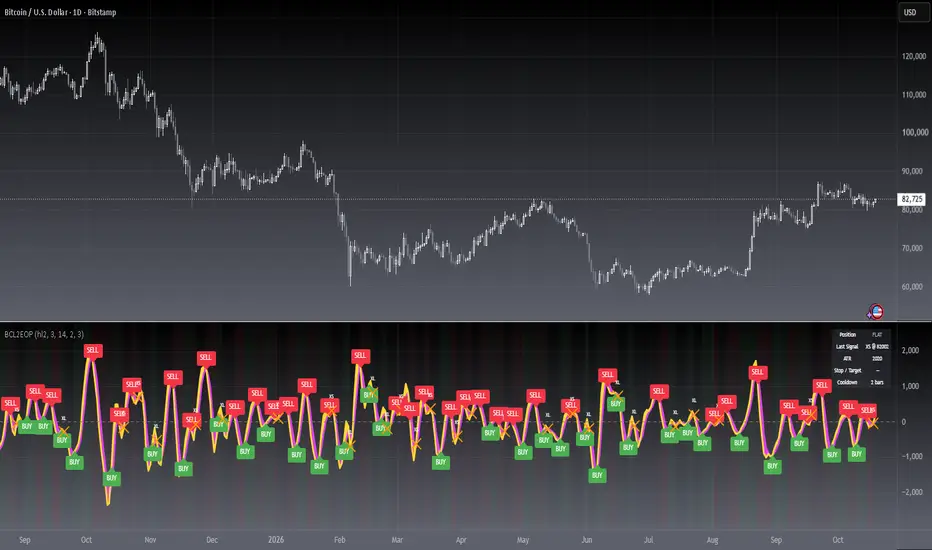
The Optimum Predictor is plotted as the subgraph below the price chart. Buy and sell signals occur when the Predict and Smooth2 lines cross. Based on Dr. Ehlers comments, most of these signals are indeed prescient. The Optimum Predictor could probably work best in trading systems when used in conjunction with other
rules to eliminate the false signals.
Key Signal
Smooth --> 4 bar WMA w/ 1 bar lag
Detrender --> The amplitude response of a minimum-length HT can be improved by adjusting the filter coefficients by
trial and error. HT does not allow DC component at zero frequency for transformation. So, Detrender is used to remove DC component/ trend component.
Q1 --> Quadrature phase signal
I1 --> In-phase signal
Period --> Dominant Cycle in bars
SmoothPeriod --> Period with complex averaging
Predict --> fast line of optimum predictor
Smooth2 --> slow line of optimum predictor
Pros and Cons
100% John F. Ehlers definition translation of original work, even variable names are the same. This help readers who would like to use pine to read his book. If you had read his works, then you will be quite familiar with my code style.
Remarks
The 16th script for Blackcat1402 John F. Ehlers Week publication.
Readme
In real life, I am a prolific inventor. I have successfully applied for more than 60 international and regional patents in the past 12 years. But in the past two years or so, I have tried to transfer my creativity to the development of trading strategies. Tradingview is the ideal platform for me. I am selecting and contributing some of the hundreds of scripts to publish in Tradingview community. Welcome everyone to interact with me to discuss these interesting pine scripts.
The scripts posted are categorized into 5 levels according to my efforts or manhours put into these works.
Level 1 : interesting script snippets or distinctive improvement from classic indicators or strategy. Level 1 scripts can usually appear in more complex indicators as a function module or element.
Level 2 : composite indicator/strategy. By selecting or combining several independent or dependent functions or sub indicators in proper way, the composite script exhibits a resonance phenomenon which can filter out noise or fake trading signal to enhance trading confidence level.
Level 3 : comprehensive indicator/strategy. They are simple trading systems based on my strategies. They are commonly containing several or all of entry signal, close signal, stop loss, take profit, re-entry, risk management, and position sizing techniques. Even some interesting fundamental and mass psychological aspects are incorporated.
Level 4 : script snippets or functions that do not disclose source code. Interesting element that can reveal market laws and work as raw material for indicators and strategies. If you find Level 1~2 scripts are helpful, Level 4 is a private version that took me far more efforts to develop.
Level 5 : indicator/strategy that do not disclose source code. private version of Level 3 script with my accumulated script processing skills or a large number of custom functions. I had a private function library built in past two years. Level 5 scripts use many of them to achieve private trading strategy.
Nota Keluaran
Correct label bar_index issueNota Keluaran
OVERVIEWThe [blackcat] L2 Ehlers Optimum Predictor is a technical analysis indicator that applies John Ehlers' Optimum Predictor algorithm to forecast price movements. It provides both raw and smoothed signal lines, along with visual buy/sell signals.
FEATURES
• Advanced price prediction using Ehlers' Optimum Predictor algorithm
• Dual visualization: raw predictor line and smoothed signal line
• Automatic buy/sell labels at signal crossovers
• Customizable source price input
• Dynamic period adjustment for optimal forecasting
HOW TO USE
Add the indicator to your chart
Select your preferred source price from the inputs
Monitor the interaction between the Signal (fuchsia) and Predict (yellow) lines
Look for crossover points marked by BUY/SELL labels
INTERPRETATION
• When the Predict line crosses above the Signal line → Potential buying opportunity
• When the Predict line crosses below the Signal line → Potential selling opportunity
• The filled area between lines indicates current trend direction:
Yellow fill: Uptrend
Fuchsia fill: Downtrend
LIMITATIONS
• No built-in stop-loss or take-profit levels
• Performance may vary across different market conditions
• Requires sufficient historical data for accurate calculations
NOTES
• The indicator uses a combination of smoothing techniques and Hilbert transforms
• Default settings are optimized for most trading scenarios
• For best results, use in conjunction with other technical indicators
Nota Keluaran
█ OVERVIEWThis open-source indicator turns John Ehlers' Optimum Predictor into a complete trading system: governed long/short signals, ATR-adaptive take-profit and stop-loss levels, position background shading and a four-channel alert suite.
The classic Predict/Signal oscillator is preserved one-to-one, while every trading decision is filtered by a position-state machine with cooldown and same-bar entry/exit exclusivity.
█ CONCEPTS
The script is built on three layers:
• Predictor core: Ehlers' Optimum Predictor estimates the dominant cycle from price with a Hilbert-style homodyne discriminator and projects the detrended price one bar ahead (yellow line), which is then smoothed into a Signal line (fuchsia).
• Signal governance: cross events are only honored when the position state, a configurable cooldown and same-bar entry/exit exclusivity allow them, suppressing whipsaw signal clusters in ranging markets.
• Risk module: once a trade is active, stop-loss and take-profit reference prices are derived from the entry price and ATR multiples, adapting automatically to each symbol's volatility.
█ HOW TO USE
1 — Add the indicator to a chart; it renders in its own pane around the zero line.
2 — Read signals: a green BUY label marks a confirmed long entry, a red SELL label a confirmed short entry.
3 — Manage the trade: orange XL/XS crosses mark signal-based exits, while the data window and dashboard show the active stop-loss and take-profit levels.
4 — Create alerts from the four alert conditions, or use the "Any alert() function call" option to receive dynamic messages that include the trigger price.
Input Parameters
• Source: price series fed to the predictor (default hl2)
• Cooldown Bars: minimum number of bars between any two signals, 0 disables the filter (default 3)
• Same-bar Entry/Exit Exclusivity: gives exits priority over entries within a single bar (default on)
• ATR Length: averaging period of the volatility measure (default 14)
• Stop Loss (xATR): stop distance in ATR multiples (default 2.0)
• Take Profit (xATR): target distance in ATR multiples (default 3.0)
• Show TP/SL Levels: toggles stop/target output in the data window and dashboard (default on)
• Show Dashboard: toggles the status table in the top-right corner (default on)
• Show Position Background: toggles the long/short background shading (default on)
█ FEATURES
• Dual-direction signals with state-machine gating, cooldown and same-bar exclusivity
• Signal-based exit marks (XL/XS) completing the trade loop
• ATR-adaptive stop-loss and take-profit reference levels
• Position background shading and a top-right status dashboard: position, last signal with price, ATR, stop/target and cooldown bars left
• Four alertcondition channels plus dynamic bar-close-confirmed alert() messages
• Bounded label history (maximum 500 labels)
█ SIGNALS
Visual Elements
• Yellow line: one-bar-ahead predictor value
• Fuchsia line: smoothed predictor (signal line); the fill between the two shows which side leads
• Green BUY label below the bar: confirmed long entry
• Red SELL label above the bar: confirmed short entry
• Orange XL / XS cross: long / short exit on the opposite cross
• Light green / light red background: long / short position state
• Dashboard (top-right): live position, last signal with price, ATR, stop/target prices and remaining cooldown
█ IMPLEMENTATION NOTES
• The predictor follows Ehlers' Optimum Predictor: 4-tap price smoothing, detrending, in-phase/quadrature components, homodyne cycle estimation clamped to 6-50 bars, and a detrended EMA projection.
• Cross events are evaluated on every bar in global scope; alerts fire with freq_once_per_bar_close, so all signals are bar-close confirmed and non-repainting.
• Stop and target prices are shown in the data window and the dashboard instead of being drawn on the pane, because absolute price levels would distort the oscillator's scale around zero.
• The cycle estimator needs a warm-up period; values over the first bars may be unstable.
█ LIMITATIONS
• The predictor is mean-reverting by design and can cross repeatedly in strong trends; the cooldown and state machine reduce but do not eliminate whipsaw trades
• Stop-loss and take-profit levels are references for manual or broker-side execution; the indicator does not place orders
• Not recommended below the 5-minute timeframe due to noise
█ NOTES
• Open source under the Mozilla Public License 2.0 — feel free to study and modify, attribution appreciated
• Based on John F. Ehlers' cycle-analysis research ("Rocket Science for Traders")
═════════════════════════════════════════════════════════════════════════
For questions or feedback, use the comments section below.
Feel free to use and modify — attribution appreciated.
Skrip sumber terbuka
Dalam semangat TradingView sebenar, pencipta skrip ini telah menjadikannya sumber terbuka, jadi pedagang boleh menilai dan mengesahkan kefungsiannya. Terima kasih kepada penulis! Walaupuan anda boleh menggunakan secara percuma, ingat bahawa penerbitan semula kod ini tertakluk kepada Peraturan Dalaman.

Don't miss out! The first and most important thing to do is to join my Discord chat now! Click here to start your adventure: discord.com/invite/ZTGpQJq My new github for more pine development soon: github.com/wxt-coder
Penafian
Maklumat dan penerbitan adalah tidak bertujuan, dan tidak membentuk, nasihat atau cadangan kewangan, pelaburan, dagangan atau jenis lain yang diberikan atau disahkan oleh TradingView. Baca lebih dalam Terma Penggunaan.
Skrip sumber terbuka
Dalam semangat TradingView sebenar, pencipta skrip ini telah menjadikannya sumber terbuka, jadi pedagang boleh menilai dan mengesahkan kefungsiannya. Terima kasih kepada penulis! Walaupuan anda boleh menggunakan secara percuma, ingat bahawa penerbitan semula kod ini tertakluk kepada Peraturan Dalaman.
Don't miss out! The first and most important thing to do is to join my Discord chat now! Click here to start your adventure: discord.com/invite/ZTGpQJq My new github for more pine development soon: github.com/wxt-coder
Penafian
Maklumat dan penerbitan adalah tidak bertujuan, dan tidak membentuk, nasihat atau cadangan kewangan, pelaburan, dagangan atau jenis lain yang diberikan atau disahkan oleh TradingView. Baca lebih dalam Terma Penggunaan.