Telah dikemas kini
Bubble Scanner - A - Pullback B- Reverse C- Continuation S - Str
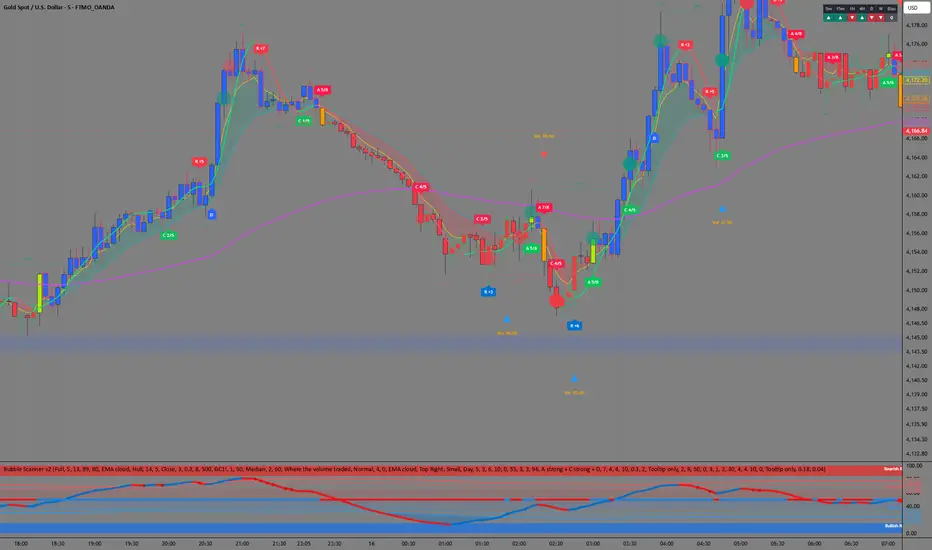
ARRUDA BUBBLES
An all-in-one intraday overlay for reading order flow, trend and market structure on one chart. Built and used on XAUUSD (5m / 10m), but it works on any symbol with volume data.
━━━━━━━━━━━━━━━━━━━━
WHAT IT SHOWS
━━━━━━━━━━━━━━━━━━━━
1) VOLUME BUBBLES
Green (buy) and red (sell) bubbles placed at the price where the volume traded. Buy / sell split comes from 1-minute intrabar data. For XAUUSD the default source is COMEX gold futures (GC1!), because spot gold only has broker tick volume. Only unusual volume is shown (relative to the median), and only the strongest bubble per window, to keep the chart clean. Hover a bubble for the exact buy / sell numbers.
2) EQUAL HIGHS / EQUAL LOWS (EQH / EQL)
Liquidity zones where price made equal tops or bottoms. Zones are marked when swept.
3) EMA 5 / 13 / 89 + CLOUD
Cloud between EMA 5 and 13 (green / red). EMA 89 as the main trend filter.
4) CANDLE COLOURS
- Blue / red body = trend up / down
- Lime / orange = the candle where the cloud flips
- Green / red outline = counter-trend candle (buy candle in a downtrend / sell candle in an uptrend)
5) MARKET STRUCTURE
HH / HL / LH / LL swings, BOS (break of structure) and CHoCH (change of character), with the broken level kept as support / resistance.
6) MULTI-TIMEFRAME TREND TABLE
5m, 15m, 1H, 4H, Daily and Weekly trend, plus a Bias score (-6 to +6).
7) HULL MOVING AVERAGE
Fast, low-lag momentum line.
8) DELTA / CVD PANEL
Buy minus sell volume per candle and cumulative volume delta, with price / CVD divergences.
9) RANGE FILTER
Shades sideways markets (narrow range or repeated cloud flips) and marks the breakout with a diamond.
━━━━━━━━━━━━━━━━━━━━
SIGNAL LABELS (SCORE)
━━━━━━━━━━━━━━━━━━━━
Each label shows a score. Hover it to see which conditions passed (✓) or failed (✗), plus a suggested entry, stop and target (next liquidity zone, or a fixed R multiple).
A x/8 — Pullback with the trend after a cloud flip. Points: Bias, EMA 89 side, structure, pullback into a zone (EQH/EQL, BOS level or EMA 89), bubble, pullback candle, delta / CVD, Hull.
B x/5 — Reversal after a liquidity sweep (EQH / EQL).
C x/5 — Continuation: pullback inside an existing trend, without a cloud flip.
S x/5 — Structure break (CHoCH / BOS) after a Higher Low / Lower High that touched a zone.
R — Breakout of a sideways range with volume confirmation.
Signals are confirmed on candle close (no repaint). Entry reference = close of the signal candle.
━━━━━━━━━━━━━━━━━━━━
ALERTS
━━━━━━━━━━━━━━━━━━━━
Separate alerts for every signal, cloud flips, BOS / CHoCH, CVD divergences and big bubbles. "Any alert() function call" sends one combined message with entry, stop, target and R, filtered by minimum score (set in "Score trigger").
━━━━━━━━━━━━━━━━━━━━
NOTES
━━━━━━━━━━━━━━━━━━━━
- Futures data (GC1!) is delayed ~10 minutes without a CME data subscription; the latest bubbles may appear late.
- Intrabar 1-minute history is limited by your TradingView plan, so bubbles and delta only exist on recent bars.
- After changing any setting, delete and recreate your alerts (alerts store the settings at the moment they are created).
- The scores are a checklist, not a guarantee. Use them as confluence together with your own analysis and risk management.
This script is for educational purposes only and is not financial advice.
An all-in-one intraday overlay for reading order flow, trend and market structure on one chart. Built and used on XAUUSD (5m / 10m), but it works on any symbol with volume data.
━━━━━━━━━━━━━━━━━━━━
WHAT IT SHOWS
━━━━━━━━━━━━━━━━━━━━
1) VOLUME BUBBLES
Green (buy) and red (sell) bubbles placed at the price where the volume traded. Buy / sell split comes from 1-minute intrabar data. For XAUUSD the default source is COMEX gold futures (GC1!), because spot gold only has broker tick volume. Only unusual volume is shown (relative to the median), and only the strongest bubble per window, to keep the chart clean. Hover a bubble for the exact buy / sell numbers.
2) EQUAL HIGHS / EQUAL LOWS (EQH / EQL)
Liquidity zones where price made equal tops or bottoms. Zones are marked when swept.
3) EMA 5 / 13 / 89 + CLOUD
Cloud between EMA 5 and 13 (green / red). EMA 89 as the main trend filter.
4) CANDLE COLOURS
- Blue / red body = trend up / down
- Lime / orange = the candle where the cloud flips
- Green / red outline = counter-trend candle (buy candle in a downtrend / sell candle in an uptrend)
5) MARKET STRUCTURE
HH / HL / LH / LL swings, BOS (break of structure) and CHoCH (change of character), with the broken level kept as support / resistance.
6) MULTI-TIMEFRAME TREND TABLE
5m, 15m, 1H, 4H, Daily and Weekly trend, plus a Bias score (-6 to +6).
7) HULL MOVING AVERAGE
Fast, low-lag momentum line.
8) DELTA / CVD PANEL
Buy minus sell volume per candle and cumulative volume delta, with price / CVD divergences.
9) RANGE FILTER
Shades sideways markets (narrow range or repeated cloud flips) and marks the breakout with a diamond.
━━━━━━━━━━━━━━━━━━━━
SIGNAL LABELS (SCORE)
━━━━━━━━━━━━━━━━━━━━
Each label shows a score. Hover it to see which conditions passed (✓) or failed (✗), plus a suggested entry, stop and target (next liquidity zone, or a fixed R multiple).
A x/8 — Pullback with the trend after a cloud flip. Points: Bias, EMA 89 side, structure, pullback into a zone (EQH/EQL, BOS level or EMA 89), bubble, pullback candle, delta / CVD, Hull.
B x/5 — Reversal after a liquidity sweep (EQH / EQL).
C x/5 — Continuation: pullback inside an existing trend, without a cloud flip.
S x/5 — Structure break (CHoCH / BOS) after a Higher Low / Lower High that touched a zone.
R — Breakout of a sideways range with volume confirmation.
Signals are confirmed on candle close (no repaint). Entry reference = close of the signal candle.
━━━━━━━━━━━━━━━━━━━━
ALERTS
━━━━━━━━━━━━━━━━━━━━
Separate alerts for every signal, cloud flips, BOS / CHoCH, CVD divergences and big bubbles. "Any alert() function call" sends one combined message with entry, stop, target and R, filtered by minimum score (set in "Score trigger").
━━━━━━━━━━━━━━━━━━━━
NOTES
━━━━━━━━━━━━━━━━━━━━
- Futures data (GC1!) is delayed ~10 minutes without a CME data subscription; the latest bubbles may appear late.
- Intrabar 1-minute history is limited by your TradingView plan, so bubbles and delta only exist on recent bars.
- After changing any setting, delete and recreate your alerts (alerts store the settings at the moment they are created).
- The scores are a checklist, not a guarantee. Use them as confluence together with your own analysis and risk management.
This script is for educational purposes only and is not financial advice.
Nota Keluaran
Bubble Scanner – A Pullback · C Continuation · D Breakout · R ReversalAll-in-one intraday overlay that combines order-flow bubbles, liquidity zones, trend and market structure with four scored signal types. Built and used on XAUUSD 5m, but it works on any symbol with volume data.
WHAT IT SHOWS
Volume bubbles: on high-volume candles, a bubble marks the price where most of the volume traded. Green means buyers dominated and red means sellers dominated; bigger bubbles mean more volume. For XAUUSD the default volume source is COMEX gold futures.
Liquidity zones: equal highs and equal lows (EQH / EQL) are drawn as zones and marked when they are swept.
Trend:
– EMA 5/13 cloud.
– EMA 89 trend filter.
– Coloured candles.
– Fast low-lag (Hull) average.
Market structure: swing labels (HH, HL, LH, LL), BOS and CHoCH.
Trend table: trend from 5m to Weekly, plus a bias score.
Range filter: shades sideways markets and blocks A signals while the market is ranging.
Oscillator panel: momentum oscillator with reversal and retest zones, a trend strip and divergence markers (Ⓓ).
Super arrows: KDE SuperTrend flips, with the volatility probability shown next to each arrow.
SIGNALS
All signals are confirmed on candle close.
A: pullback with the trend. Fires when the cloud flips colour and the score reaches the minimum (score out of 8). If the conditions disappear and come back while the cloud keeps its colour, a new A is printed.
C: continuation inside an established move (score out of 5).
D: Donchian breakout. The close breaks the 55-candle high or low, with the closed 1H and 4H trend aligned and price beyond EMA 89. Stop 3 ATR, target 3R.
R: reversal at the band. Price touches the band and closes back with a real-bodied candle while the oscillator turns. The score (+N) counts the confluences: Kalman arrow, KDE breakout, engulfing, divergence, trend consensus, and so on.
Each label’s tooltip lists the conditions that were met (✓/✗), plus the entry, stop and target.
SIGNAL TRACKING
Every signal is followed until it reaches its target, its breakeven level or its stop. The label keeps its colour, and the tooltip updates live:
OPEN: the best move so far, in pips and R.
✓ WIN: the target was reached before the stop.
BREAKEVEN: the trade reached the breakeven level, then came back to the entry.
FAILED: the stop was hit first, with the best move the trade reached before that.
Default management, which you can change:
A and C: breakeven at 2R, target 3R.
R: breakeven at 1R, target 2R.
Alternatively, a fixed pip target for every signal.
Risk and target boxes are drawn for the latest signal, showing the stop and target prices and their distance in pips.
VIEW MODES
Full: everything that is switched on.
Normal: hides the secondary details.
Clean: signals, cloud and key levels only.
Calculations are identical in every mode.
ALERTS
There are separate alerts for:
-Cloud flip and fast-average turn.
-BOS and CHoCH.
-Big bubbles.
-CVD divergence.
-A strong, C strong, D and R.
-Super arrows.
-All strong signals combined, filtered by minimum score.
Update notes (from last Bubble Scanner):
-Removed signals B and S. Kept A and C, added D (Donchian 55 breakout with the 1H/4H trend), and R is now “Reversal at the band” with a confluence score.
-A can re-appear when the cloud keeps its colour and the score recovers.
-Replaced the Delta/CVD panel with the oscillator panel (zones, retests, divergences).
-Added super arrows (KDE SuperTrend) with the volatility probability.
-Added risk and target boxes for the latest signal.
-Added live signal tracking in the label tooltips (open, win, breakeven, failed, with the pips reached). Label colours no longer change.
-Separate breakeven and target settings for A/C and for R, in R multiples or a fixed number of pips.
-Added view modes: Full, Normal and Clean.
-Combined the buy and sell alerts into one alert per signal type.

Penafian
Maklumat dan penerbitan adalah tidak bertujuan, dan tidak membentuk, nasihat atau cadangan kewangan, pelaburan, dagangan atau jenis lain yang diberikan atau disahkan oleh TradingView. Baca lebih dalam Terma Penggunaan.
Penafian
Maklumat dan penerbitan adalah tidak bertujuan, dan tidak membentuk, nasihat atau cadangan kewangan, pelaburan, dagangan atau jenis lain yang diberikan atau disahkan oleh TradingView. Baca lebih dalam Terma Penggunaan.