OPEN-SOURCE SCRIPT
ADR Contraction Tightness
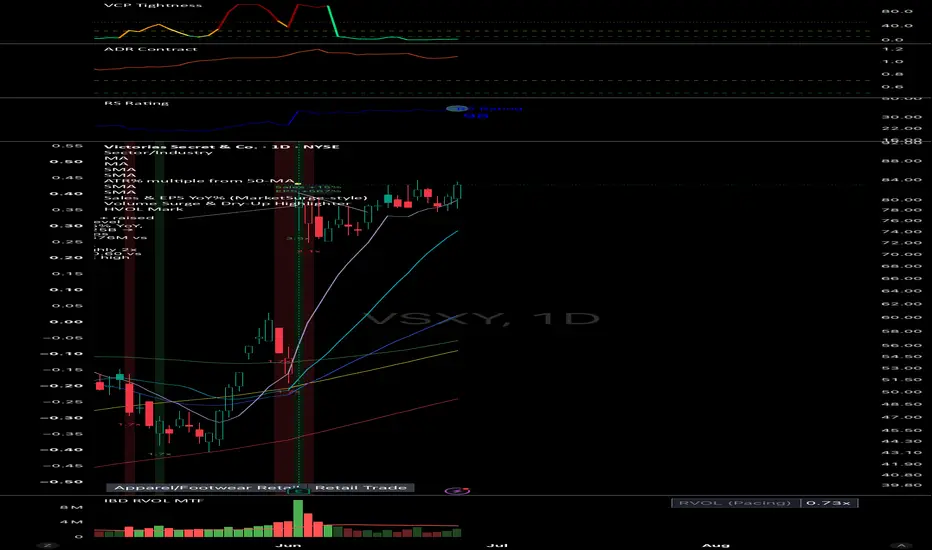
HAT IT IS
// Measures how much a stock's recent daily range has dried up versus its
// ~2.5-month baseline. A single ratio:
//
// bar_range_pct = (high - low) / low * 100 // each bar's range %
// adr_pct_short = ta.sma(bar_range_pct, 20) // recent avg daily range %
// adr_pct_long = ta.sma(bar_range_pct, 50) // baseline avg daily range %
// contraction_ratio = adr_pct_short / adr_pct_long // LOWER = TIGHTER
//
// "Tight base" when contraction_ratio <= 1.00
// "Super-tight" when contraction_ratio <= 0.70
//
// STUDY PROVENANCE
// This is measure B_0.7 ("absolute ADR% contraction") — the tightness
// measure that won the ATR Extension Study tightness-measure bake-off
// (engine: atr_phase7.py §15.6, branch atr-study). In that study B_0.7 was
// the most selective qualifier of the +50% movers: best P(+50%) lift and
// ~10 days faster to the move, versus the old normalized 0–100 VCP score
// which fired on ~99% of names. Lower = tighter. This replaces the VCP
// Tightness Score pane and is built to feed a TradingView Pine Screener.
// Measures how much a stock's recent daily range has dried up versus its
// ~2.5-month baseline. A single ratio:
//
// bar_range_pct = (high - low) / low * 100 // each bar's range %
// adr_pct_short = ta.sma(bar_range_pct, 20) // recent avg daily range %
// adr_pct_long = ta.sma(bar_range_pct, 50) // baseline avg daily range %
// contraction_ratio = adr_pct_short / adr_pct_long // LOWER = TIGHTER
//
// "Tight base" when contraction_ratio <= 1.00
// "Super-tight" when contraction_ratio <= 0.70
//
// STUDY PROVENANCE
// This is measure B_0.7 ("absolute ADR% contraction") — the tightness
// measure that won the ATR Extension Study tightness-measure bake-off
// (engine: atr_phase7.py §15.6, branch atr-study). In that study B_0.7 was
// the most selective qualifier of the +50% movers: best P(+50%) lift and
// ~10 days faster to the move, versus the old normalized 0–100 VCP score
// which fired on ~99% of names. Lower = tighter. This replaces the VCP
// Tightness Score pane and is built to feed a TradingView Pine Screener.
Skrip sumber terbuka
Dalam semangat TradingView sebenar, pencipta skrip ini telah menjadikannya sumber terbuka, jadi pedagang boleh menilai dan mengesahkan kefungsiannya. Terima kasih kepada penulis! Walaupuan anda boleh menggunakan secara percuma, ingat bahawa penerbitan semula kod ini tertakluk kepada Peraturan Dalaman.

Penafian
Maklumat dan penerbitan adalah tidak bertujuan, dan tidak membentuk, nasihat atau cadangan kewangan, pelaburan, dagangan atau jenis lain yang diberikan atau disahkan oleh TradingView. Baca lebih dalam Terma Penggunaan.
Skrip sumber terbuka
Dalam semangat TradingView sebenar, pencipta skrip ini telah menjadikannya sumber terbuka, jadi pedagang boleh menilai dan mengesahkan kefungsiannya. Terima kasih kepada penulis! Walaupuan anda boleh menggunakan secara percuma, ingat bahawa penerbitan semula kod ini tertakluk kepada Peraturan Dalaman.
Penafian
Maklumat dan penerbitan adalah tidak bertujuan, dan tidak membentuk, nasihat atau cadangan kewangan, pelaburan, dagangan atau jenis lain yang diberikan atau disahkan oleh TradingView. Baca lebih dalam Terma Penggunaan.