ATK/DEF Life Swing MAZE Labyrinth Virtual Walls
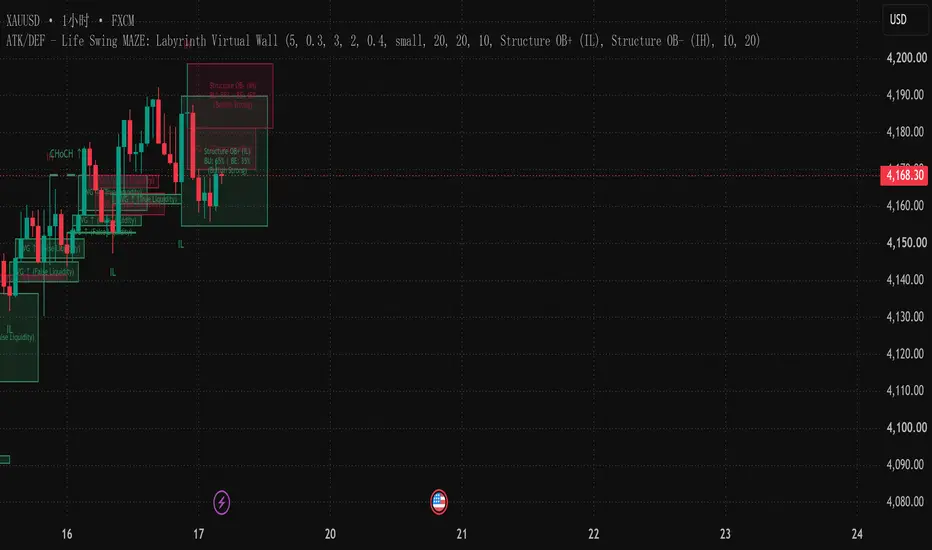
# ATK/DEF - Life Swing MAZE: Labyrinth Virtual Walls
## Market Structure, Structural Boundaries & Price Interaction
ATK/DEF - Life Swing MAZE: Labyrinth Virtual Walls is a multi-layered market analysis indicator focused on internal swing structure, structural transitions, Structure Order Blocks, Fair Value Gaps (FVGs), and swing-relative liquidity classifications.
The Virtual Walls concept represents the evolving boundaries formed by confirmed swing points, structural zones, and price imbalances. These elements provide a unified visual framework for observing how price interacts with established market structure.
## Internal Swing Structure
Internal Highs (IH) and Internal Lows (IL) identify confirmed pivot points according to the configured swing length.
These reference points establish the structural boundaries used to monitor subsequent closing-price breaks and the development of new structural zones.
Configurable price-distance and bar-spacing filters help control the density of displayed swing points.
## Structural Transitions — BOS / CHoCH
Break of Structure (BOS) and Change of Character (CHoCH) classify closing-price interactions with the latest confirmed internal swing boundaries.
BOS represents a structural break classified as consistent with the current trend state, while CHoCH represents a break associated with a transition in that state.
Dashed reference lines and directional labels display these structural events in relation to their originating swing levels.
## Structure Order Blocks — Virtual Boundaries
The indicator maintains the latest bullish and bearish Structure Order Block zones derived from confirmed internal swing points.
Each zone is displayed as a bounded price region with a configurable right-side projection. Its accompanying classification presents a programmed bullish-versus-bearish percentage distribution adjusted according to the current structural state.
These percentages are rule-based display values, not statistically validated probabilities or measured transaction-side activity.
Active zones are removed when their programmed closing-price invalidation conditions are met or when a newer corresponding zone replaces them.
## Fair Value Gaps — Price Imbalance
Bullish and bearish Fair Value Gaps identify three-candle price gaps that satisfy the indicator's detection conditions.
Each zone displays its boundaries, directional classification, and projected price range. A configurable retention limit manages the number of recent zones displayed on the chart.
The FVG framework provides context for examining displacement-related price gaps and their relationship to surrounding structural boundaries.
## Liquidity-Related Price Classification
The indicator evaluates each newly detected FVG against the latest confirmed internal swing reference.
A bullish FVG is classified relative to the latest internal high, while a bearish FVG is classified relative to the latest internal low. The resulting labels distinguish True Liquidity from False Liquidity according to these programmed conditions.
These classifications describe price relationships with selected structural references. They do not independently confirm actual liquidity conditions, stop-order activity, or the intentions of market participants.
## The Labyrinth Virtual Walls Framework
The framework combines four analytical dimensions:
- **Internal Structure:** Confirmed IH and IL reference points.
- **Structural Transitions:** BOS and CHoCH classifications.
- **Structural Zones:** Latest bullish and bearish Structure Order Blocks.
- **Imbalance Interaction:** Bullish and bearish FVGs with swing-relative liquidity classifications.
Together, these components provide a layered view of structural boundaries, price displacement, and the changing relationship between current price action and previously established zones.
## Analytical Scope & Limitations
ATK/DEF - Life Swing MAZE: Labyrinth Virtual Walls is designed for visual market-structure and price-behavior analysis.
Swing points require confirmation through the configured pivot length, which means their appearance occurs after the original pivot bar. When chart locking is enabled, structural processing is restricted to confirmed bars.
Order Block percentages and liquidity labels follow the indicator's programmed rules and should not be interpreted as guaranteed outcomes or independently verified market measurements.
The indicator does not execute or provide trading instructions.
## Chart References
Reference 01:
Reference 02:
Reference 03:
Reference 04:
## Market Structure, Structural Boundaries & Price Interaction
ATK/DEF - Life Swing MAZE: Labyrinth Virtual Walls is a multi-layered market analysis indicator focused on internal swing structure, structural transitions, Structure Order Blocks, Fair Value Gaps (FVGs), and swing-relative liquidity classifications.
The Virtual Walls concept represents the evolving boundaries formed by confirmed swing points, structural zones, and price imbalances. These elements provide a unified visual framework for observing how price interacts with established market structure.
## Internal Swing Structure
Internal Highs (IH) and Internal Lows (IL) identify confirmed pivot points according to the configured swing length.
These reference points establish the structural boundaries used to monitor subsequent closing-price breaks and the development of new structural zones.
Configurable price-distance and bar-spacing filters help control the density of displayed swing points.
## Structural Transitions — BOS / CHoCH
Break of Structure (BOS) and Change of Character (CHoCH) classify closing-price interactions with the latest confirmed internal swing boundaries.
BOS represents a structural break classified as consistent with the current trend state, while CHoCH represents a break associated with a transition in that state.
Dashed reference lines and directional labels display these structural events in relation to their originating swing levels.
## Structure Order Blocks — Virtual Boundaries
The indicator maintains the latest bullish and bearish Structure Order Block zones derived from confirmed internal swing points.
Each zone is displayed as a bounded price region with a configurable right-side projection. Its accompanying classification presents a programmed bullish-versus-bearish percentage distribution adjusted according to the current structural state.
These percentages are rule-based display values, not statistically validated probabilities or measured transaction-side activity.
Active zones are removed when their programmed closing-price invalidation conditions are met or when a newer corresponding zone replaces them.
## Fair Value Gaps — Price Imbalance
Bullish and bearish Fair Value Gaps identify three-candle price gaps that satisfy the indicator's detection conditions.
Each zone displays its boundaries, directional classification, and projected price range. A configurable retention limit manages the number of recent zones displayed on the chart.
The FVG framework provides context for examining displacement-related price gaps and their relationship to surrounding structural boundaries.
## Liquidity-Related Price Classification
The indicator evaluates each newly detected FVG against the latest confirmed internal swing reference.
A bullish FVG is classified relative to the latest internal high, while a bearish FVG is classified relative to the latest internal low. The resulting labels distinguish True Liquidity from False Liquidity according to these programmed conditions.
These classifications describe price relationships with selected structural references. They do not independently confirm actual liquidity conditions, stop-order activity, or the intentions of market participants.
## The Labyrinth Virtual Walls Framework
The framework combines four analytical dimensions:
- **Internal Structure:** Confirmed IH and IL reference points.
- **Structural Transitions:** BOS and CHoCH classifications.
- **Structural Zones:** Latest bullish and bearish Structure Order Blocks.
- **Imbalance Interaction:** Bullish and bearish FVGs with swing-relative liquidity classifications.
Together, these components provide a layered view of structural boundaries, price displacement, and the changing relationship between current price action and previously established zones.
## Analytical Scope & Limitations
ATK/DEF - Life Swing MAZE: Labyrinth Virtual Walls is designed for visual market-structure and price-behavior analysis.
Swing points require confirmation through the configured pivot length, which means their appearance occurs after the original pivot bar. When chart locking is enabled, structural processing is restricted to confirmed bars.
Order Block percentages and liquidity labels follow the indicator's programmed rules and should not be interpreted as guaranteed outcomes or independently verified market measurements.
The indicator does not execute or provide trading instructions.
## Chart References
Reference 01:
Reference 02:
Reference 03:
Reference 04:

Penafian
Maklumat dan penerbitan adalah tidak bertujuan, dan tidak membentuk, nasihat atau cadangan kewangan, pelaburan, dagangan atau jenis lain yang diberikan atau disahkan oleh TradingView. Baca lebih dalam Terma Penggunaan.
Penafian
Maklumat dan penerbitan adalah tidak bertujuan, dan tidak membentuk, nasihat atau cadangan kewangan, pelaburan, dagangan atau jenis lain yang diberikan atau disahkan oleh TradingView. Baca lebih dalam Terma Penggunaan.