OPEN-SOURCE SCRIPT
Supercharged MA Momentum Oscillator (v6,Secondary Levels)
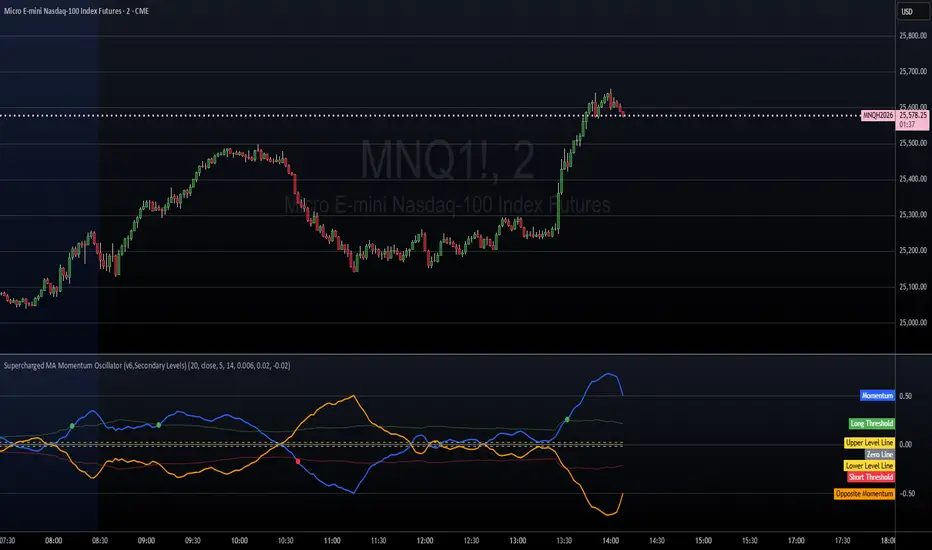
Supercharged MA Momentum Oscillator (Dots on Line)
Description:
The Supercharged MA Momentum Oscillator is a trend and momentum-based tool designed to highlight short-term market momentum relative to a moving average. It provides a visual way to identify potential entry and exit points using a combination of smoothed momentum, ATR-based thresholds, and upper/lower momentum levels.
Key Features:
Smooth momentum line derived from a moving average slope.
Opposite momentum line for contrarian signals.
ATR-based thresholds to detect meaningful momentum shifts.
Upper and lower momentum levels for stronger confirmation of overbought/oversold conditions.
Buy/sell dots plotted on the momentum line to highlight potential trade opportunities.
Customizable inputs for moving average length, smoothing, ATR period, and thresholds.
How to Use:
Momentum Interpretation:
Blue Line (Momentum): Represents the primary momentum.
Orange Line (Opposite Momentum): Represents the inverse momentum for contrarian observation.
Thresholds & Levels:
Green/Red Lines (ATR Thresholds): Define minor trigger zones for potential momentum changes.
Yellow Dashed Lines (Upper/Lower Levels): Define major momentum levels; stronger signals occur when momentum crosses these.
Trade Signals:
Buy Signal (Green Dot): Momentum crosses above both the ATR long threshold and the upper momentum level.
Sell Signal (Red Dot): Momentum crosses below both the ATR short threshold and the lower momentum level.
Dots appear directly on the momentum line to easily visualize trade triggers.
Customization:
Adjust the MA Length and Smoothing to fit the timeframe and asset volatility.
Modify ATR Length and Threshold Factor to fine-tune sensitivity.
Change Upper/Lower Momentum Levels to capture stronger or weaker signals.
Tips:
Best used in combination with trend analysis or other technical indicators for confirmation.
Ideal for spotting momentum reversals or identifying potential breakout entries.
Works on multiple timeframes — shorter timeframes will show more frequent signals, longer timeframes filter noise.
Note:
This indicator is for educational and informational purposes. Always use proper risk management and confirm signals with other analysis before executing trades.
Description:
The Supercharged MA Momentum Oscillator is a trend and momentum-based tool designed to highlight short-term market momentum relative to a moving average. It provides a visual way to identify potential entry and exit points using a combination of smoothed momentum, ATR-based thresholds, and upper/lower momentum levels.
Key Features:
Smooth momentum line derived from a moving average slope.
Opposite momentum line for contrarian signals.
ATR-based thresholds to detect meaningful momentum shifts.
Upper and lower momentum levels for stronger confirmation of overbought/oversold conditions.
Buy/sell dots plotted on the momentum line to highlight potential trade opportunities.
Customizable inputs for moving average length, smoothing, ATR period, and thresholds.
How to Use:
Momentum Interpretation:
Blue Line (Momentum): Represents the primary momentum.
Orange Line (Opposite Momentum): Represents the inverse momentum for contrarian observation.
Thresholds & Levels:
Green/Red Lines (ATR Thresholds): Define minor trigger zones for potential momentum changes.
Yellow Dashed Lines (Upper/Lower Levels): Define major momentum levels; stronger signals occur when momentum crosses these.
Trade Signals:
Buy Signal (Green Dot): Momentum crosses above both the ATR long threshold and the upper momentum level.
Sell Signal (Red Dot): Momentum crosses below both the ATR short threshold and the lower momentum level.
Dots appear directly on the momentum line to easily visualize trade triggers.
Customization:
Adjust the MA Length and Smoothing to fit the timeframe and asset volatility.
Modify ATR Length and Threshold Factor to fine-tune sensitivity.
Change Upper/Lower Momentum Levels to capture stronger or weaker signals.
Tips:
Best used in combination with trend analysis or other technical indicators for confirmation.
Ideal for spotting momentum reversals or identifying potential breakout entries.
Works on multiple timeframes — shorter timeframes will show more frequent signals, longer timeframes filter noise.
Note:
This indicator is for educational and informational purposes. Always use proper risk management and confirm signals with other analysis before executing trades.
Skrip sumber terbuka
Dalam semangat TradingView sebenar, pencipta skrip ini telah menjadikannya sumber terbuka, jadi pedagang boleh menilai dan mengesahkan kefungsiannya. Terima kasih kepada penulis! Walaupuan anda boleh menggunakan secara percuma, ingat bahawa penerbitan semula kod ini tertakluk kepada Peraturan Dalaman.

Penafian
Maklumat dan penerbitan adalah tidak bertujuan, dan tidak membentuk, nasihat atau cadangan kewangan, pelaburan, dagangan atau jenis lain yang diberikan atau disahkan oleh TradingView. Baca lebih dalam Terma Penggunaan.
Skrip sumber terbuka
Dalam semangat TradingView sebenar, pencipta skrip ini telah menjadikannya sumber terbuka, jadi pedagang boleh menilai dan mengesahkan kefungsiannya. Terima kasih kepada penulis! Walaupuan anda boleh menggunakan secara percuma, ingat bahawa penerbitan semula kod ini tertakluk kepada Peraturan Dalaman.
Penafian
Maklumat dan penerbitan adalah tidak bertujuan, dan tidak membentuk, nasihat atau cadangan kewangan, pelaburan, dagangan atau jenis lain yang diberikan atau disahkan oleh TradingView. Baca lebih dalam Terma Penggunaan.