Telah dikemas kini
Moon Boys BTC Liquidation Heatmap
747
═════════════════════════════════════════════════════════════
Moon Boys BTC LIQUIDATION HEATMAP
═════════════════════════════════════════════════════════════
Visualize high-probability liquidation zones across Bitcoin futures markets using multi-exchange data and algorithmic pivot detection.
═══ OVERVIEW ═══
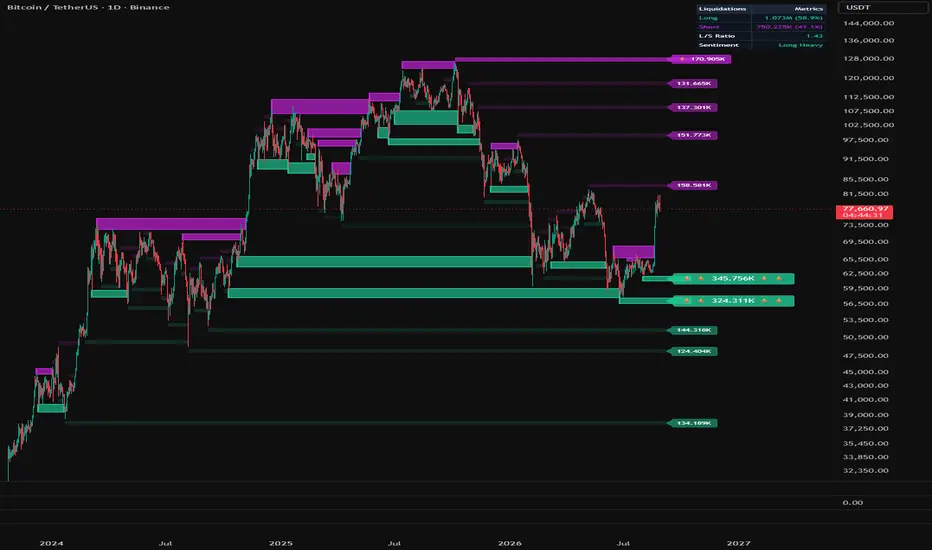
This indicator tracks where leveraged positions cluster and highlights areas where cascading liquidations are likely to occur. By combining Open Interest data from major exchanges with volume-weighted pivot analysis, it shows you where the market's leverage is stacked before price gets there.
Perfect for:
• Anticipating volatility zones
• Identifying potential reversal areas
• Avoiding stop-hunt regions
• Confirming breakout/breakdown levels
═══ KEY FEATURES ═══
🎨 HEAT-MAPPED LIQUIDATION ZONES
└─ Green zones = Long liquidations (below price)
└─ Purple zones = Short liquidations (above price)
└─ Color intensity = Volume significance
⚡ SMART SIGNIFICANCE DETECTION
└─ Top 30% of levels automatically highlighted
└─ Lightning bolt icon (⚡) marks critical zones
└─ Enhanced with borders, brighter colors, and bold labels
└─ Weak levels stay subtle to reduce noise
📊 MULTI-EXCHANGE DATA
└─ Binance Futures Open Interest
└─ Bybit Futures Open Interest
└─ Coinbase Spot Volume
└─ Toggle exchanges individually
🕐 MULTI-TIMEFRAME COMPATIBLE
└─ Works on all timeframes: 1m to Monthly
└─ Auto-adjusts filters and aggregation per timeframe
└─ Consistent performance across different chart scales
🎯 CLEAN VISUAL DESIGN
└─ Labels positioned right of chart (off candles)
└─ Connector lines show which label belongs to which zone
└─ Hit levels fade automatically
└─ Only active zones are labeled
═══ HOW TO READ IT ═══
┌─────────────────────────────────────────────────────────┐
│ ZONE TYPE │ MEANING │
├─────────────────────────────────────────────────────────┤
│ 🟢 Green (below) │ Long liquidation cluster │
│ │ → Potential bounce/support zone │
├─────────────────────────────────────────────────────────┤
│ 🟣 Purple (above)│ Short liquidation cluster │
│ │ → Potential rejection/resistance │
├─────────────────────────────────────────────────────────┤
│ ⚡ With icon │ Top 30% most significant levels │
│ │ → Higher probability of reaction │
└─────────────────────────────────────────────────────────┘
═══ TRADING APPLICATIONS ═══
📈 TREND CONTINUATION
→ Price rejects from liquidation zone = trend strength
→ Watch for bounces at green zones in uptrends
→ Watch for rejections at purple zones in downtrends
🔄 REVERSAL SETUPS
→ Price diving into dense liquidation clusters
→ Heavy volume + liquidation zone = potential turning point
→ Combine with momentum divergence for confirmation
⚠️ RISK MANAGEMENT
→ Avoid entries near untouched significant levels
→ High probability of stop hunts and slippage
→ Wait for price to sweep and confirm before entry
🧩 CONFLUENCE TRADING
→ Layer with support/resistance
→ Combine with volume profile nodes
→ Use alongside order flow indicators
→ Validate with moving averages or trend tools
═══ SETTINGS GUIDE ═══
📡 DATA FEEDS
├─ Binance Futures OI: Toggle Binance data
├─ Bybit Futures OI: Toggle Bybit data
└─ Coinbase Spot Vol: Toggle Coinbase data
🔍 LIQUIDATION DETECTION
├─ Lookback Bars (100-2000): Historical scan range
├─ Pivot Width (1-20): Detection sensitivity
│ └─ Higher = fewer, stronger levels
├─ Target Leverage Tier: Distance from pivot
│ ├─ 25x-50x: 2-4% zones
│ ├─ 50x-100x: 0.8-2% zones (default)
│ └─ 100x+: 0.3-0.8% zones
├─ Min Activity Filter: Remove weak signals
└─ Extend Levels (0-200): Project zones forward
🎨 VISUAL OPTIONS
├─ Long/Short Colors: Customize zone colors
├─ Heat Contrast (0.1-3.0): Intensity scaling
├─ Significance Threshold (0.3-0.95): Top % to highlight
├─ Touched Transparency: Fade amount for hit levels
└─ Label Offset: Distance from chart edge
═══ HOW IT WORKS ═══
1. PIVOT IDENTIFICATION
Scans historical data for swing highs/lows using pivot detection
2. VOLUME AGGREGATION
Combines Open Interest + Volume at each pivot point
Creates weighted metric for liquidation probability
3. ZONE PROJECTION
Calculates liquidation bands based on selected leverage tier
Projects zones where stop losses are likely stacked
4. SIGNIFICANCE RANKING
Normalizes all levels against historical range
Top percentile gets enhanced visual treatment
5. REAL-TIME TRACKING
Monitors price interaction with each zone
Active zones extend forward | Hit zones fade and lock
Memory management removes outdated levels
═══ BEST PRACTICES ═══
✅ DO:
• Use on high-liquidity BTC pairs (BTCUSDT, BTCUSD)
• Combine with volume and order flow analysis
• Look for confluences with key technical levels
• Use higher timeframes for more reliable zones
• Adjust leverage tier based on market volatility
❌ DON'T:
• Trade liquidation zones blindly without confirmation
• Ignore broader market context and trend direction
• Overtrade every single level that appears
• Use as sole entry/exit criteria
• Forget proper position sizing and risk management
═══ TECHNICAL NOTES ═══
• Built with Pine Script v6
• Max 500 boxes, 100 labels for optimal performance
• Auto-scales for different timeframe data availability
• Uses request.security() for multi-exchange aggregation
• Dynamic memory management prevents chart lag
═══ DISCLAIMER ═══
This indicator visualizes potential liquidation zones based on historical volume and open interest data. It does NOT:
• Predict future price movements with certainty
• Guarantee reversals or continuations
• Provide buy/sell signals
• Replace proper risk management
Liquidation zones show where leverage is concentrated — not where price will definitely react. Always use this tool as part of a comprehensive trading strategy alongside technical analysis, risk management, and market context.
📚 EDUCATIONAL USE ONLY | NOT FINANCIAL ADVICE
═══ RESOURCES ═══
Pine Script Documentation
→ tradingview.com/pine-script-docs/
Understanding Liquidations
→ academy.binance.com/en/articles/what-is-liquidation-in-crypto-trading
Open Interest Data
→ coinglass.com/
Leverage Trading Education
→ investopedia.com/terms/l/leverage.asp
═══════════════════════════════════════════════════════════
Built for the Bitcoin trading community 🚀
Because knowing where the leverage sits is half the battle 💎
═══════════════════════════════════════════════════════════
═════════════════════════════════════════════════════════════
Moon Boys BTC LIQUIDATION HEATMAP
═════════════════════════════════════════════════════════════
Visualize high-probability liquidation zones across Bitcoin futures markets using multi-exchange data and algorithmic pivot detection.
═══ OVERVIEW ═══
This indicator tracks where leveraged positions cluster and highlights areas where cascading liquidations are likely to occur. By combining Open Interest data from major exchanges with volume-weighted pivot analysis, it shows you where the market's leverage is stacked before price gets there.
Perfect for:
• Anticipating volatility zones
• Identifying potential reversal areas
• Avoiding stop-hunt regions
• Confirming breakout/breakdown levels
═══ KEY FEATURES ═══
🎨 HEAT-MAPPED LIQUIDATION ZONES
└─ Green zones = Long liquidations (below price)
└─ Purple zones = Short liquidations (above price)
└─ Color intensity = Volume significance
⚡ SMART SIGNIFICANCE DETECTION
└─ Top 30% of levels automatically highlighted
└─ Lightning bolt icon (⚡) marks critical zones
└─ Enhanced with borders, brighter colors, and bold labels
└─ Weak levels stay subtle to reduce noise
📊 MULTI-EXCHANGE DATA
└─ Binance Futures Open Interest
└─ Bybit Futures Open Interest
└─ Coinbase Spot Volume
└─ Toggle exchanges individually
🕐 MULTI-TIMEFRAME COMPATIBLE
└─ Works on all timeframes: 1m to Monthly
└─ Auto-adjusts filters and aggregation per timeframe
└─ Consistent performance across different chart scales
🎯 CLEAN VISUAL DESIGN
└─ Labels positioned right of chart (off candles)
└─ Connector lines show which label belongs to which zone
└─ Hit levels fade automatically
└─ Only active zones are labeled
═══ HOW TO READ IT ═══
┌─────────────────────────────────────────────────────────┐
│ ZONE TYPE │ MEANING │
├─────────────────────────────────────────────────────────┤
│ 🟢 Green (below) │ Long liquidation cluster │
│ │ → Potential bounce/support zone │
├─────────────────────────────────────────────────────────┤
│ 🟣 Purple (above)│ Short liquidation cluster │
│ │ → Potential rejection/resistance │
├─────────────────────────────────────────────────────────┤
│ ⚡ With icon │ Top 30% most significant levels │
│ │ → Higher probability of reaction │
└─────────────────────────────────────────────────────────┘
═══ TRADING APPLICATIONS ═══
📈 TREND CONTINUATION
→ Price rejects from liquidation zone = trend strength
→ Watch for bounces at green zones in uptrends
→ Watch for rejections at purple zones in downtrends
🔄 REVERSAL SETUPS
→ Price diving into dense liquidation clusters
→ Heavy volume + liquidation zone = potential turning point
→ Combine with momentum divergence for confirmation
⚠️ RISK MANAGEMENT
→ Avoid entries near untouched significant levels
→ High probability of stop hunts and slippage
→ Wait for price to sweep and confirm before entry
🧩 CONFLUENCE TRADING
→ Layer with support/resistance
→ Combine with volume profile nodes
→ Use alongside order flow indicators
→ Validate with moving averages or trend tools
═══ SETTINGS GUIDE ═══
📡 DATA FEEDS
├─ Binance Futures OI: Toggle Binance data
├─ Bybit Futures OI: Toggle Bybit data
└─ Coinbase Spot Vol: Toggle Coinbase data
🔍 LIQUIDATION DETECTION
├─ Lookback Bars (100-2000): Historical scan range
├─ Pivot Width (1-20): Detection sensitivity
│ └─ Higher = fewer, stronger levels
├─ Target Leverage Tier: Distance from pivot
│ ├─ 25x-50x: 2-4% zones
│ ├─ 50x-100x: 0.8-2% zones (default)
│ └─ 100x+: 0.3-0.8% zones
├─ Min Activity Filter: Remove weak signals
└─ Extend Levels (0-200): Project zones forward
🎨 VISUAL OPTIONS
├─ Long/Short Colors: Customize zone colors
├─ Heat Contrast (0.1-3.0): Intensity scaling
├─ Significance Threshold (0.3-0.95): Top % to highlight
├─ Touched Transparency: Fade amount for hit levels
└─ Label Offset: Distance from chart edge
═══ HOW IT WORKS ═══
1. PIVOT IDENTIFICATION
Scans historical data for swing highs/lows using pivot detection
2. VOLUME AGGREGATION
Combines Open Interest + Volume at each pivot point
Creates weighted metric for liquidation probability
3. ZONE PROJECTION
Calculates liquidation bands based on selected leverage tier
Projects zones where stop losses are likely stacked
4. SIGNIFICANCE RANKING
Normalizes all levels against historical range
Top percentile gets enhanced visual treatment
5. REAL-TIME TRACKING
Monitors price interaction with each zone
Active zones extend forward | Hit zones fade and lock
Memory management removes outdated levels
═══ BEST PRACTICES ═══
✅ DO:
• Use on high-liquidity BTC pairs (BTCUSDT, BTCUSD)
• Combine with volume and order flow analysis
• Look for confluences with key technical levels
• Use higher timeframes for more reliable zones
• Adjust leverage tier based on market volatility
❌ DON'T:
• Trade liquidation zones blindly without confirmation
• Ignore broader market context and trend direction
• Overtrade every single level that appears
• Use as sole entry/exit criteria
• Forget proper position sizing and risk management
═══ TECHNICAL NOTES ═══
• Built with Pine Script v6
• Max 500 boxes, 100 labels for optimal performance
• Auto-scales for different timeframe data availability
• Uses request.security() for multi-exchange aggregation
• Dynamic memory management prevents chart lag
═══ DISCLAIMER ═══
This indicator visualizes potential liquidation zones based on historical volume and open interest data. It does NOT:
• Predict future price movements with certainty
• Guarantee reversals or continuations
• Provide buy/sell signals
• Replace proper risk management
Liquidation zones show where leverage is concentrated — not where price will definitely react. Always use this tool as part of a comprehensive trading strategy alongside technical analysis, risk management, and market context.
📚 EDUCATIONAL USE ONLY | NOT FINANCIAL ADVICE
═══ RESOURCES ═══
Pine Script Documentation
→ tradingview.com/pine-script-docs/
Understanding Liquidations
→ academy.binance.com/en/articles/what-is-liquidation-in-crypto-trading
Open Interest Data
→ coinglass.com/
Leverage Trading Education
→ investopedia.com/terms/l/leverage.asp
═══════════════════════════════════════════════════════════
Built for the Bitcoin trading community 🚀
Because knowing where the leverage sits is half the battle 💎
═══════════════════════════════════════════════════════════
Nota Keluaran
7 New features updates to the BTC Liquidations Heatmap.1. Smart Level Consolidation: Liquidation levels that form closely together are now automatically merged into a single, highly accurate zone based on a configurable percentage distance (default set to 2.5% for Daily/Swing charts).
2.. Super Liquidation Visuals: When multiple pools combine into a massive liquidity cluster, they are now highlighted with double lightning bolts (⚡⚡), larger text, and thicker box borders to easily identify high-magnet areas.
3. Added a customizable on-chart dashboard (default Top-Right) that tracks live data for active unhit levels.
4. Displays Total Active Long vs. Short liquidation volumes.
5. Calculates the live Long/Short Liquidation Ratio and determines the current structural Market Bias (Long Heavy, Short Heavy, or Balanced).
6. Sweep Hit Detection: Fixed an issue where deep wicks would prematurely invalidate overlapping liquidation zones. Price must now fully sweep through the bottom of a long box (or top of a short box) to mark it as hit, ensuring stacked levels merge correctly.
7. Edge-Gap Calculation: The merging math now looks at the actual empty space between box edges rather than just center-to-center distance, preventing levels from missing their merge threshold on higher timeframes.
Nota Keluaran
This update to the indicator includes1. Enhanced Transparency: Softened the background fill colors and adjusted gradient transparencies for active liquidation zones. This prevents the boxes from overpowering the price action and makes the indicator much easier on the eyes, especially in Dark Mode.
2. Mobile-Friendly Scaling: Scaled down the border thickness, label text size, and label background opacity for "Super Liquidation" (⚡⚡) events so they no longer clutter or block smaller mobile screens.
Also there are some dashboard terminology updates including.
1. Streamlined the on-chart dashboard for a cleaner look.
2. Headers have been renamed to Liquidations and Metrics.
3. Row labels are now more concise (Long, Short, L/S Ratio, and Sentiment).
Nota Keluaran
Moon Boys Liquidation Heatmap (Universal Multi-Asset Upgrade)This update transforms the indicator into a fully dynamic, asset-agnostic liquidity tracking engine that automatically adapts to any cryptocurrency chart.
What's New:
Dynamic Multi-Asset Support: Automatically detects the underlying asset on your active chart (syminfo.basecurrency) and constructs the corresponding Open Interest and volume feeds on the fly. Works natively across BTC, ETH, SOL, BNB, XRP, and other major perpetual markets.
Fail-Safe Data Engine: Integrated ignore_invalid_symbol=true across all exchange data feeds (request.security). Prevents script crashes on assets not listed across all three default venues (e.g., Coinbase spot vs. Binance/Bybit perps).
Unified Universal Workspace: Consolidated into a single, clean indicator title without requiring separate scripts or chart-specific manual inputs.
Dynamic Liquidity Clustering: Retains proximity-based level merging and multi-timeframe OI aggregation to highlight high-probability liquidation sweeps and resting liquidity zones.

Penafian
Maklumat dan penerbitan adalah tidak bertujuan, dan tidak membentuk, nasihat atau cadangan kewangan, pelaburan, dagangan atau jenis lain yang diberikan atau disahkan oleh TradingView. Baca lebih dalam Terma Penggunaan.
Penafian
Maklumat dan penerbitan adalah tidak bertujuan, dan tidak membentuk, nasihat atau cadangan kewangan, pelaburan, dagangan atau jenis lain yang diberikan atau disahkan oleh TradingView. Baca lebih dalam Terma Penggunaan.